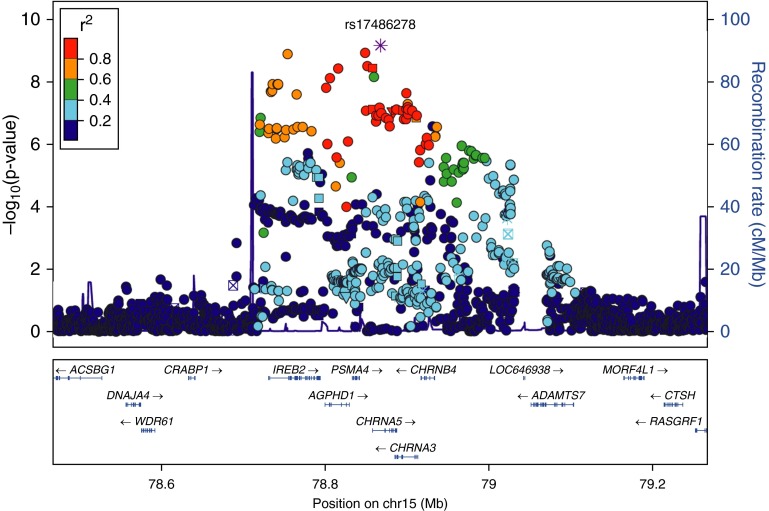
Figure 5.
Local association plots for significant loci in the meta-analysis of subjects with COPD with PA/A greater than 1 versus smoking control subjects in COPDGene NHWs, AAs, and ECLIPSE. The x axis is chromosomal position, and the y axis shows the –log10 P value. The most significant SNP at each locus is labeled in purple (denoted by asterisk, as it is located in a transcription factor binding site conserved in a multiple-species alignment), with other SNPs colored by degree of LD (r2). Plots were created using LocusZoom.

