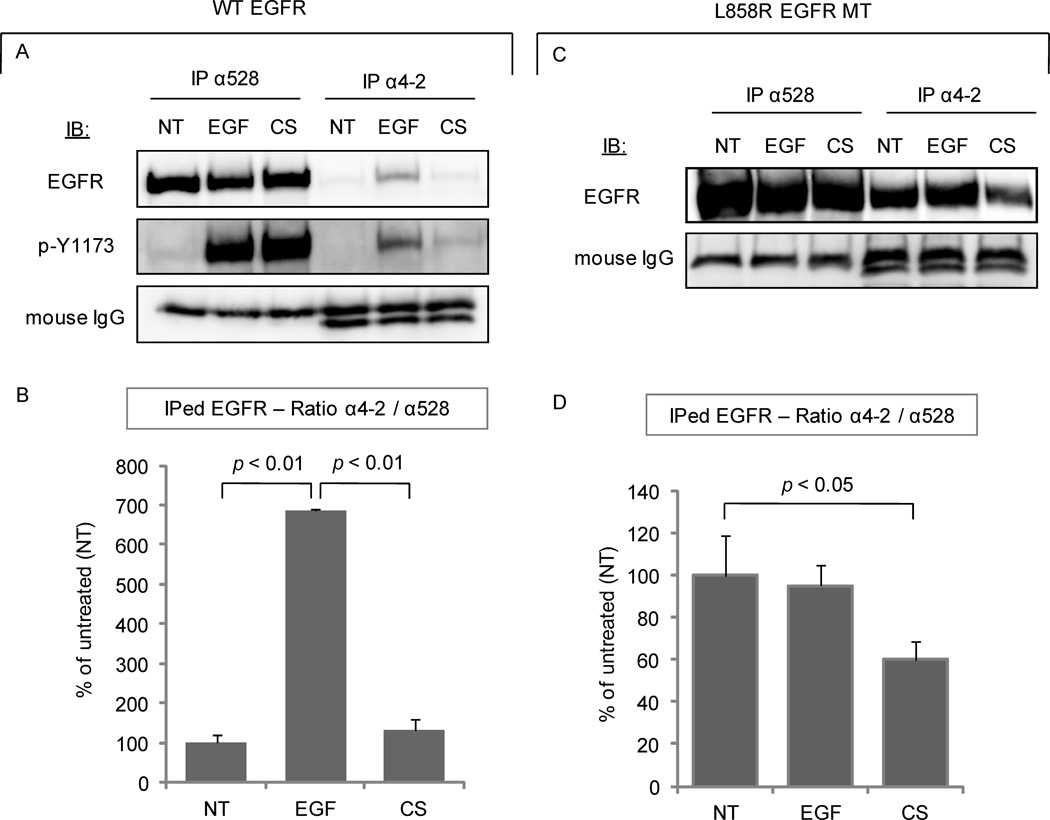
Figure 4. CS exposure induces a novel conformation of EGFR.
A. A549 cells were treated (or not) with 100 ng/ml EGF for 15 min. or exposed to smoke from 1 cigarette for 30 min. EGFR was IPed from 300 µg of the total cell lysates using either α528 or α4-2 Ab and then IBed for total receptor or for Tyr-1173 phosphorylation. B. Histogram represents the average of three experiments for the ratio between the bands’ intensity of EGFR IPed with the α4-2 Ab and the total EGFR (IPed with α528 Ab). C. NIH-3T3 cells stably over-expressing L858R EGFR MT were treated and MT EGFR was IPed as above, in A. D. Histogram for the EGFR MT is built as above, in B.

