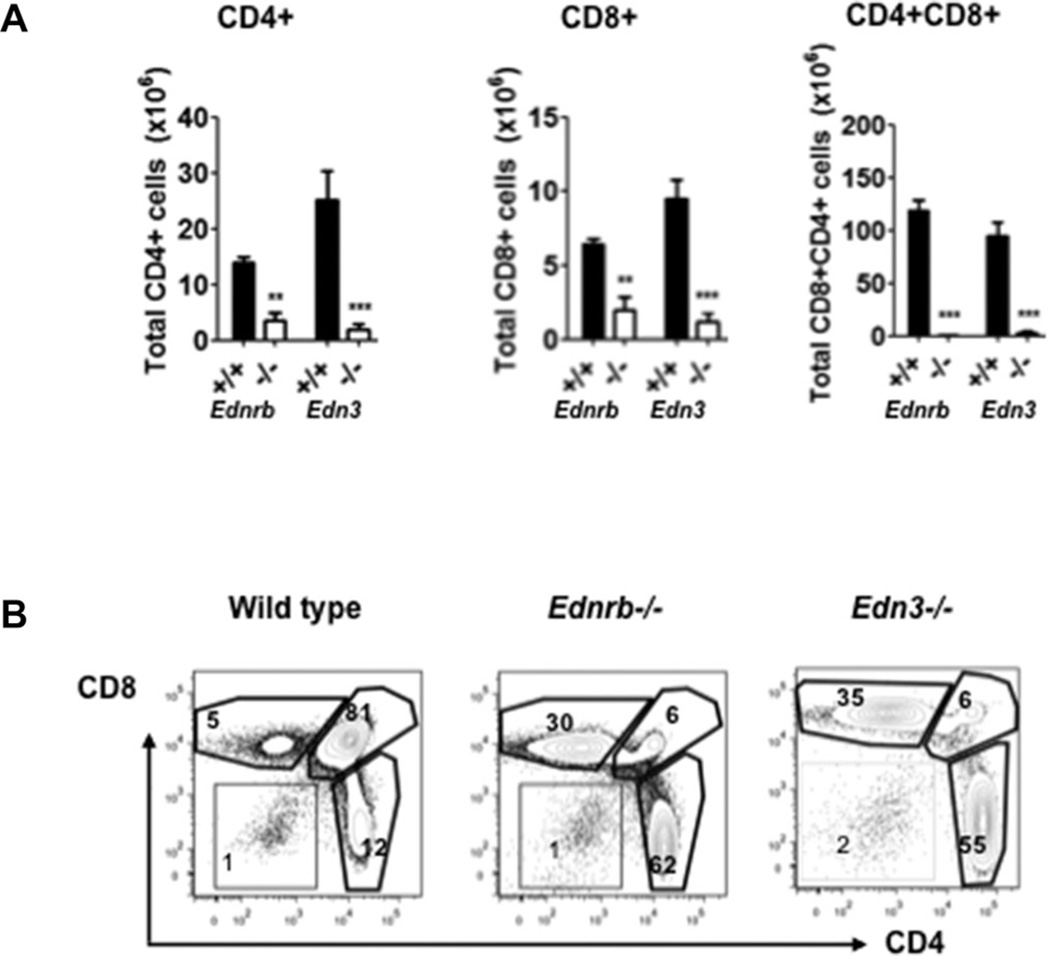
Figure 2.
Thymocyte composition in Ednrb- and Edn3-null mice. (A) Summary of total numbers of CD4+, CD8+, and CD4+CD8+ cells in thymus. (B) Representative FACS profiles and percentages of CD4+, CD8+, and CD4+CD8+ cells in thymus. Data are shown as mean ± SEM of n = 5–6 mice/group, and are representative of two independent experiments performed with both genotypes. *p < 0.05, **p < 0.01, and ***p < 0.001. Comparisons between Ednrb−/− and +/+, Edn3−/−, and +/+ were performed using Student’s t-test.

