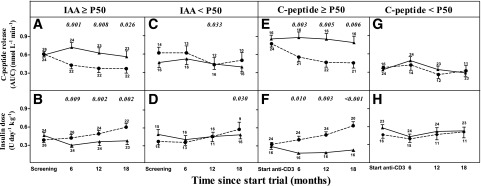
Figure 1.

Efficacy tests for AUC C-peptide release (panels A, C, E, and G) and insulin dose (panels B, D, F, and H) during 18-month follow-up in placebo-treated (●) and ChAglyCD3-treated (▲) patients stratified according to IAA levels at screening above (panels A and B) or below (panels C and D) the median of all 80 patients or for clamp-derived AUC C-peptide release above (panels E and F) or below (panels G and H) the median value of the entire group. Values represent means ± SE. The small numbers next to the whiskers indicate the number of observations at the respective times. Significant P values for differences in change in AUC C-peptide from baseline between anti-CD3 and placebo groups are shown in italic above the relevant times.
