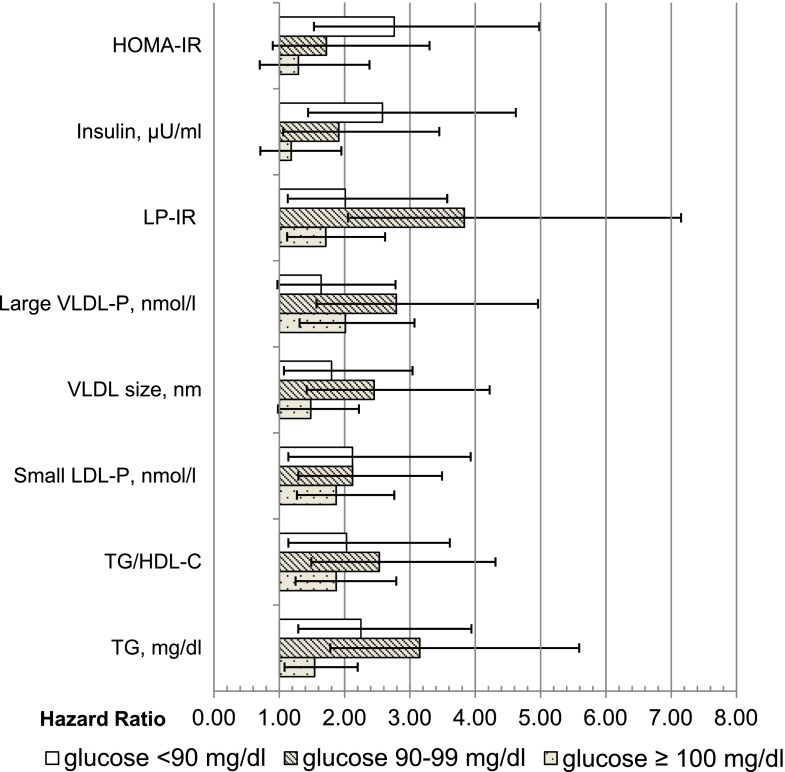
Figure 1.
Adjusted HRs (95% CIs) of incident diabetes among the entire study sample, comparing quartile 4 vs. quartile 1, adjusted for age, sex, race/ethnicity, BMI, family history of diabetes, alcohol use, smoking, physical activity, and treatment group (none, lipid-lowering medication use, or HT use).

