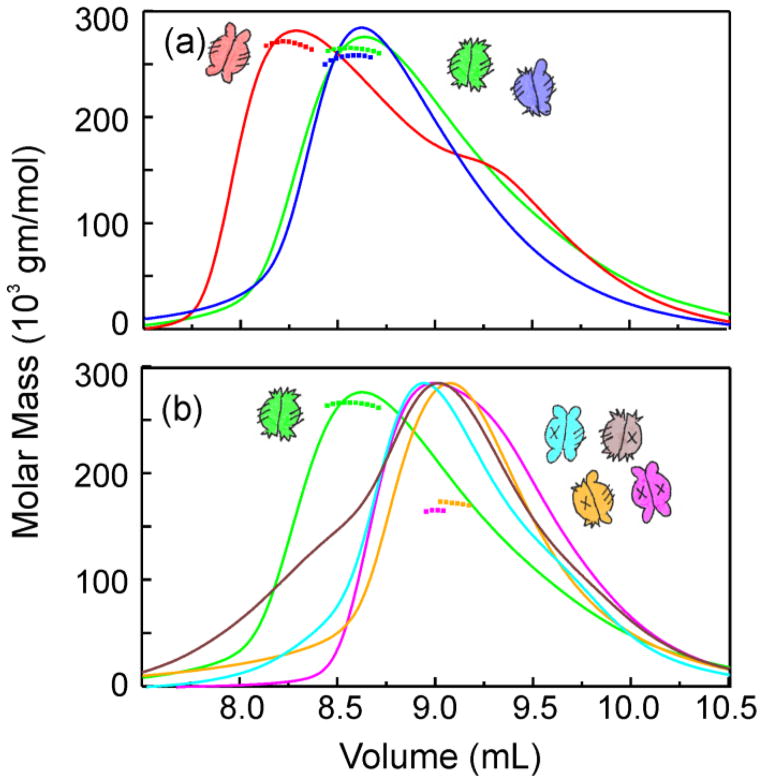
Figure 4. Stoichiometry of SecA:SecB complexes.
Protein mixtures were subjected to size exclusion chromatography and the eluent was monitored to determine protein concentration by change in refractive index and molar mass by static light scatter. The traces represent concentration and the symbols molar mass. Only every tenth data point is shown for mass determination. The traces were normalized to the maximal peak height for each of the chromatograms for ease of comparing the positions of the peaks. The samples applied in 100 μL contained both SecA and the SecB species indicated at 20 μM each. (a) SecA with: SecB wild-type (red), SecB142 (Cc, green), SecB Ca (blue); (b) SecA with: SecB142(Cc, green) repeated for reference, SecB Ba (cyan), SecBL75Q (magenta), SecB Da (gold), and SecB Cd (brown).

