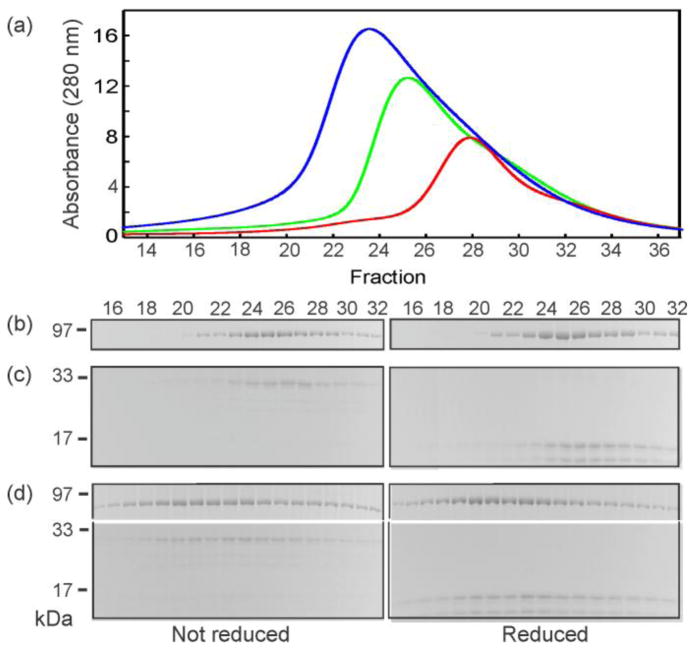
Figure 5. Representative analysis of SecA:SecB complex by column chromatography and gel electrophoresis.
(a) Absorbance profiles of size exclusion chromatography of SecA only applied at 20 μM (green), SecB hybrid Bc only applied at 20 μM (red) and a mixture of SecA and SecB hybrid at 20 μM each (blue). Analyses of the protein content of the fractions eluted by gel electrophoresis: (b) SecA only, (c) SecB hybrid Bc only, and (d) a mixture of SecA and SecB hybrid Bc. Similar analyses were carried out for each of the complexes of SecA with hybrid SecB species. SecA and SecB stain with different efficiency. Therefore, it was necessary to load four times the quantity of SecB relative to the quantity of SecA for analyses by gel electrophoresis.

