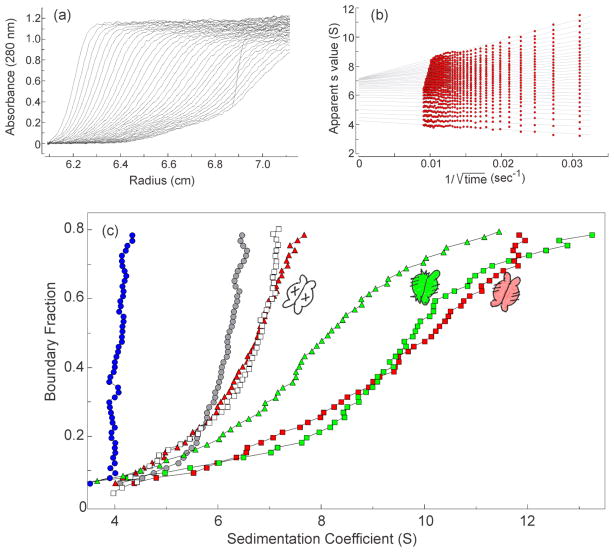
Figure 6. Sedimentation velocity centrifugation.
(a) Raw data. The centrifuge cell contained SecA (4 μM dimer) and SecBL75Q (8 μM tetramer) in 10 mM Hepes-KOH, 300 mM KOAc, 5 mM Mg(OAc)2, 1 mM TCEP, pH 7.3. Thirty-five successive scans were analyzed as shown in (b). (b) van Holde & Weischet analysis. The sedimenting boundaries shown in (a) were divided into 50 equal segments along the concentration axis. Each point is the apparent sedimentation coefficient (s*) of each fraction of the boundary, and each vertical array of 50 points represents one sedimenting boundary. The s* values are extrapolated to the y-axis (infinite time) and plotted to give distribution plots as shown in (c). (c) Distribution plots of s values. The samples were: SecB wild-type (blue circles); SecA (gray circles); SecA and SecBL75Q (open squares); SecA and SecB wild-type (red squares); SecA, SecB wild-type and zinc-peptide (red triangles); SecA and SecB hybrid Ca (green squares); SecA, SecB hybrid Ca and zinc-peptide (green triangles). In all cases SecA was 4 μM dimer and SecB was 4 μM tetramer, except SecBL75Q which was 8 μM, and zinc-containing peptide was 25 μM. The peptide was added to the centrifuge cells after the first centrifugation to gather data for the complexes. The cells are shaken to suspend pelleted material and centrifugation repeated to assess the effect of the peptide.

