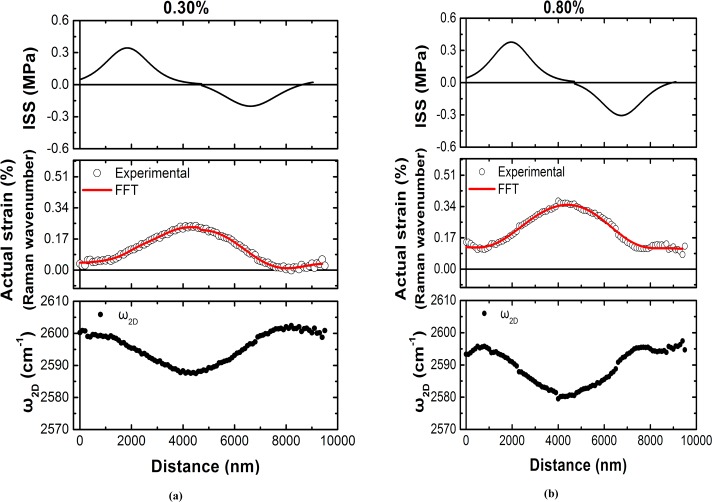
Figure 5.
(lower) Raman wavenumber distributions of the ω2D peak for the simply supported case at applied strains of (a) 0.30% and (b) 0.80%. (center) The resulting axial strain distributions via the Raman wavenumber shift for (a) 0.30% and (b) 0.80%. The red solid line is a guide to the eye. (upper) The corresponding interfacial shear stress distributions along the whole length of the flake for (a) 0.30% and (b) 0.80%.

