Figure 6.

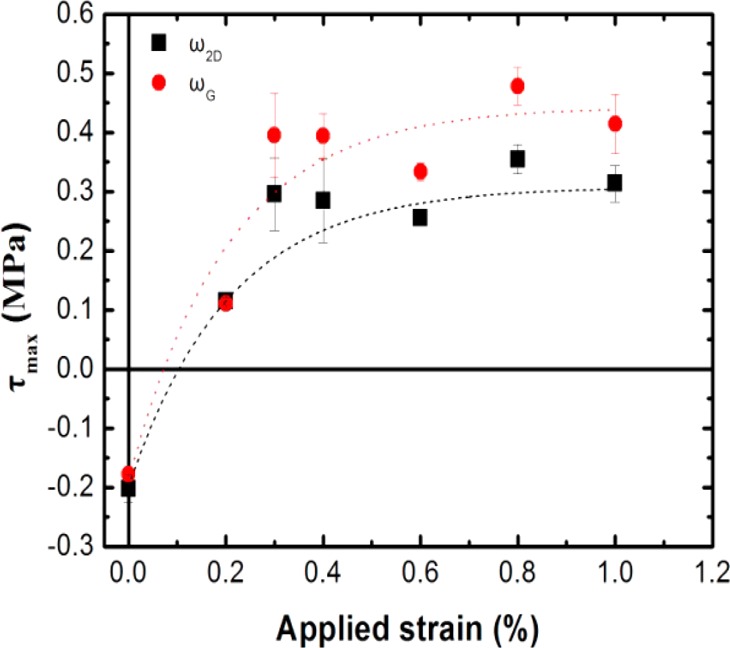
Maximum interfacial shear stress (average values for both edges of the examined flake) as a function of the applied tensile strain extracted from ωG and ω2D bands. The dot lines are a guide to the eye.

Maximum interfacial shear stress (average values for both edges of the examined flake) as a function of the applied tensile strain extracted from ωG and ω2D bands. The dot lines are a guide to the eye.