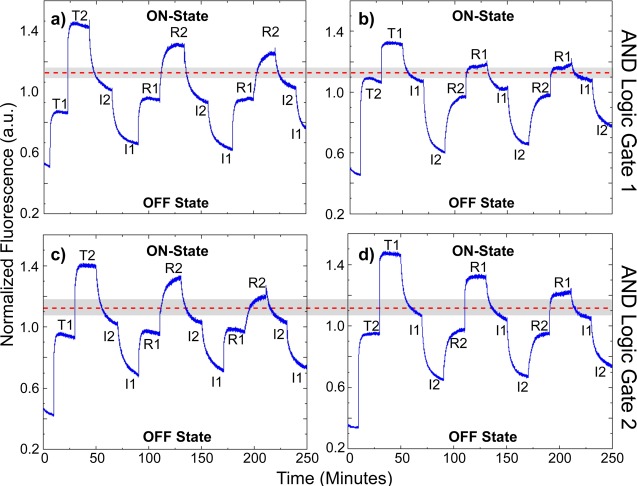
Figure 3.
Dynamic switching data demonstrating sequentially switchable excitonic AND logic functionality by examining fluorescent emission changes resulting from injecting TAMRA (T1 or T2), invasion (I1 or I2), or restoration (R1 or R2) strands. The data were obtained by exciting F at 450 nm and monitoring the fluorescence of C at 668 nm. Repeated AND logic operation by introducing (a) T1 to AND logic gate 1 prior to T2; (b) T2 to AND logic gate 1 prior to T1; (c) T1 to AND logic gate 2 prior to T2; (d) T2 to AND logic gate 2 prior to T1. All data were normalized by concentration and corrected for photobleaching (Supporting Information, S3). The logic threshold (red dashed line) defines the midpoint of the logic threshold window. The dynamic threshold window (gray area) defines the region between the minimum fluorescence obtained with the attachment of both logic input chromophores (T1 and T2) and the maximum fluorescence obtained with the attachment of one logic input chromophore (T1 or T2) for a given logic gate design operated over three complete OFF–ON–OFF switching cycles.

