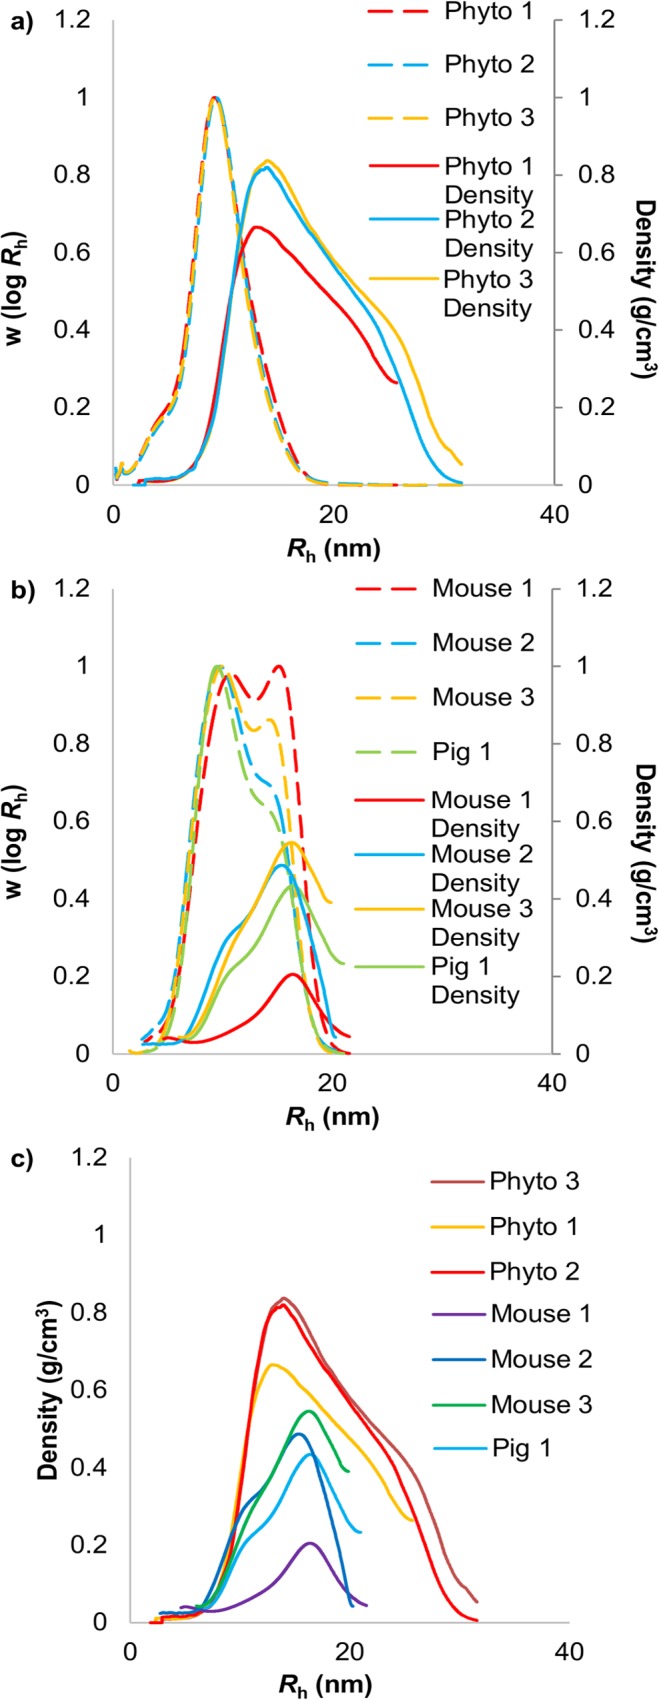
Fig 6. Aqueous SEC weight and molecular density distributions of glucans.

Phytoglycogen (a) and liver glycogen (b) weight distributions (dashed lines) and molecular density distributions (c) (solid lines). Weight distributions have been normalized to the distribution peak while the density distributions are absolute.
