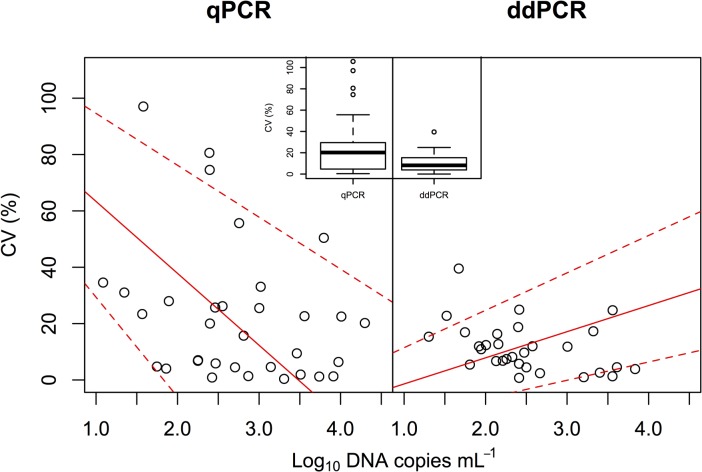
Fig 2. Relationships between eDNA concentrations of common carp and coefficients of variation (CV, %) measured using qPCR and ddPCR.
Solid red and dashed red lines indicate Type II regression and 95% CI, respectively. Boxes in the box plot indicate median ± quartiles, and points indicate the outliers. The means of CVs were significantly different by Welch’s t-test (t = –2.98, p = 0.0047).

