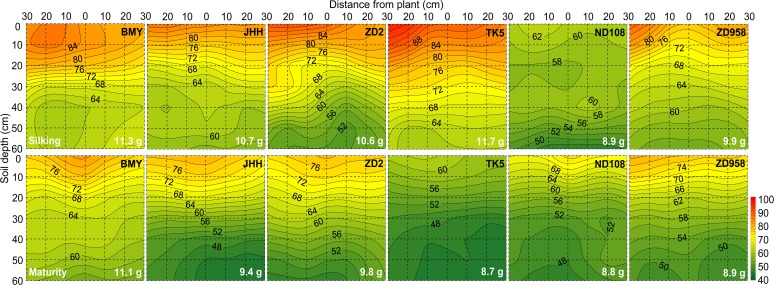
Fig 4. Two dimensional distribution of soil NH4OAc extractable K concentration (mg/kg) of different maize varieties at silking (the upper six panels) and maturity (the bottom six panels) in 2009.
The NH4OAc extractable K was sampled in a soil volume of 60 cm (length)× 30 cm (width) × 60 cm (depth). Each 10×10 cm2 area was the projection of average NH4OAc extractable K in the three 10×10×10 cm3 soil cubes across the width of the monolith. Maize varieties are indicated at the top right side and total soil residual NH4OAc extractable K content (g) in the whole 60×30×60 cm3 soil volume are indicated at the bottom right side in each panel, respectively. Data are mean values from 3 replicates of each genotype.

