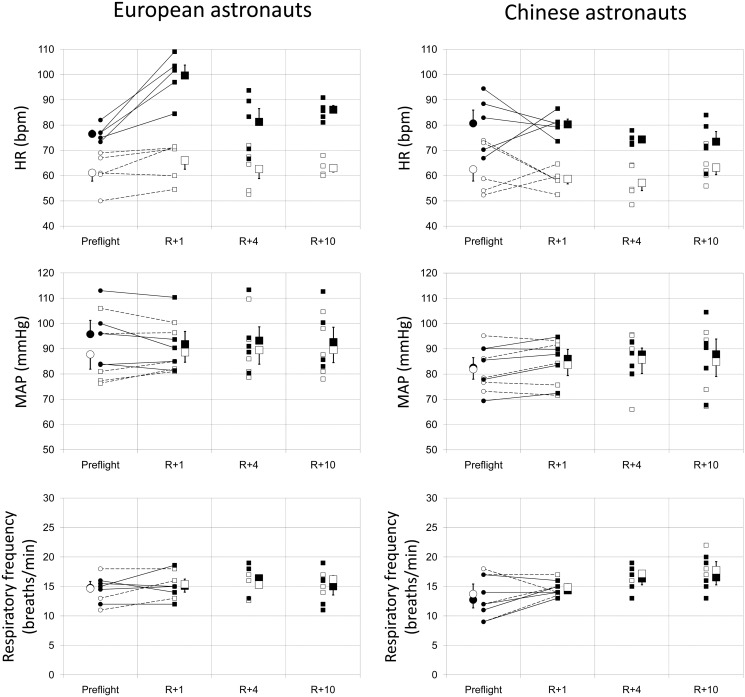
Fig 1. Evolutions in heart rate (HR; top), mean arterial pressure (MAP; middle), and respiratory rate (bottom) before and after spaceflight in the European and Chinese astronauts in the supine and standing position.
R+1 = the first day after landing; R+4 = the 4th day after landing; R+10 = the 10th day after landing. ○ (small open circle) baseline individual data in supine position; ● (small black filled circle) baseline individual data in standing position; □ (small open spuare) post-flight individual data in supine position; ■ (small black filled square) post-flight individual data in standing position; ○ (large open circle) baseline mean value in supine position; ● (large black filled circle) baseline mean value in standing position; □ (large open square) post-flight mean value in supine position; ■ (large black filled square) post-flight mean value in standing position.

