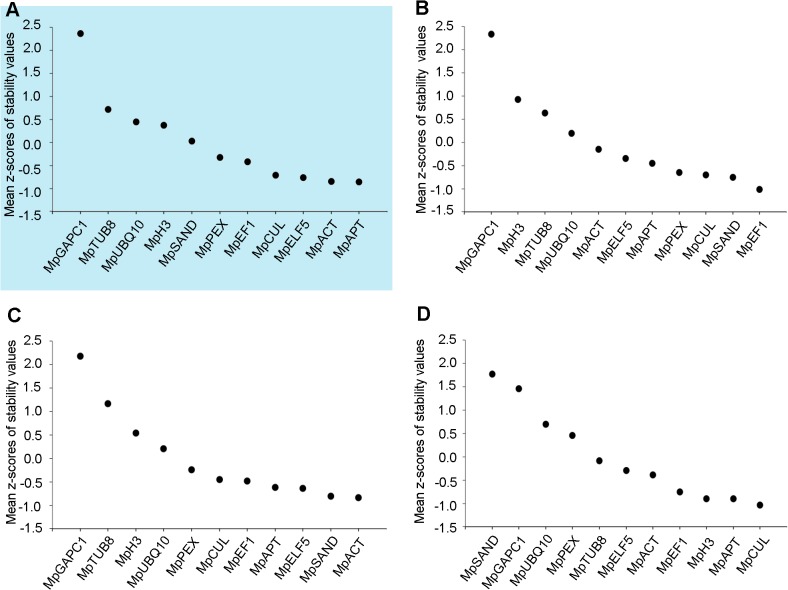
Fig 2. Average variation in transcript levels for each candidate gene.
All 22 conditions tested (A, highlighted in blue), development group (B), abiotic stress group (C), and hormone group (D). Variation is represented as the average of z-scores derived from geNorm and NormFinder results. The lower the z-score, the more invariant the transcript levels between samples.

