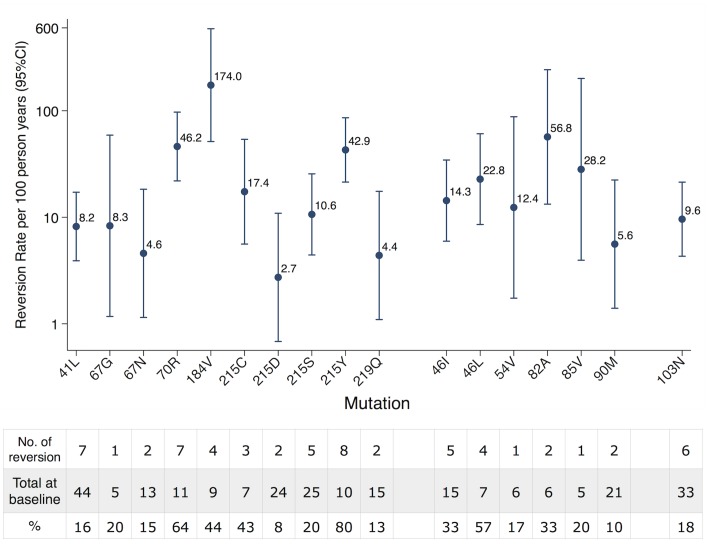
Fig 1. Reversion rate of individual TDRM.
Reversion rate was quantified via an interval-censored survival model using an exponential distribution. The table below showed the number of reversion and total number observed at baseline for each TDRM. NRTI resistance mutations showed the largest variability that included both the fastest (184V) and the slowest (215D) reverting TDRM.

