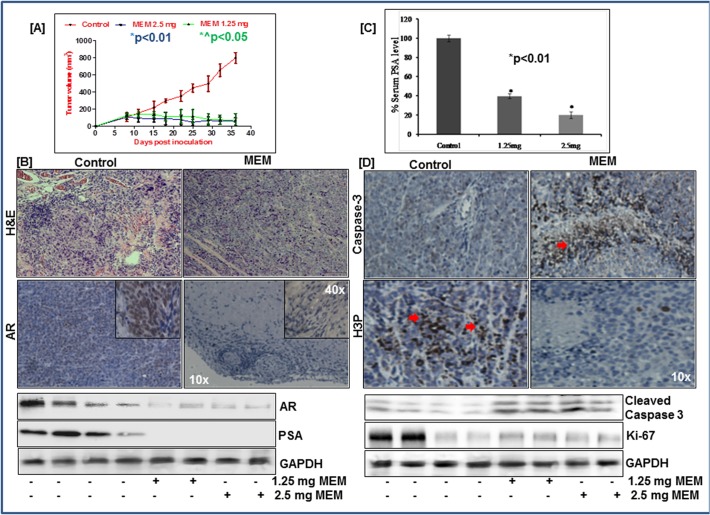
Fig 6. MEM inhibits growth of CWR22Rν1xenografts in athymic nude mice.
a. Average tumor volume of DMSO, 2.5mg & 1.25mg MEM injected mice plotted over days after CWR22Rν1 tumor xenografts implanted in athymic nude mice. Values represent mean±SE of six mice, where MEM (1.25mg) *^p<0.05 and MEM (2.5mg) *p<0.01 versus DMSO treated control was considered significant. b. Top panel: H&E staining of MEM treated xenograft tumor tissue vs control. Immunohistochemical analysis of AR in MEM treated tumor tissue vs untreated control. Bottom panel: Whole cell lysates of tumor xenografts from animals treated with/without MEM were subjected to SDS-polyacrylamide gel electrophoresis. Equal loading was confirmed by reprobing with GAPDH. The immunoblots shown are representative of three independent experiments with similar results. c. Serum PSA levels of MEM treated mice were analyzed by ELISA, as described in Materials and Methods. MEM (1.25mg) and MEM (2.5mg) *p<0.01 versus DMSO treated control was considered significant. d. Top panel: Immunohistochemical analysis of H3P & cleaved caspase 3 in MEM treated tumor tissue vs untreated control. Bottom panel: Whole cell lysates of tumor xenografts from animals treated with/without MEM were subjected to SDS-polyacrylamide gel electrophoresis. Equal loading was confirmed by reprobing with GAPDH. The immunoblots shown are representative of three independent experiments with similar results.

