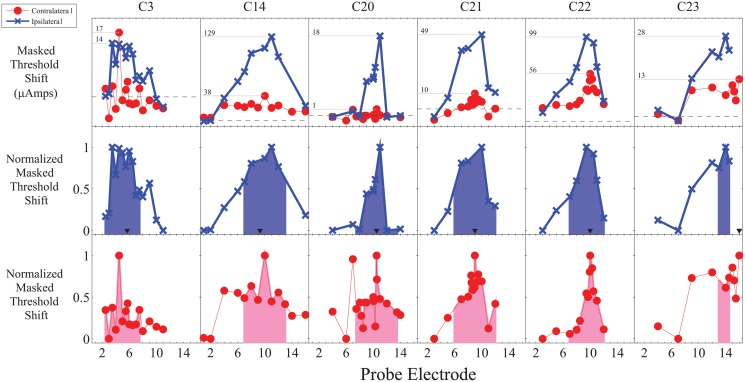
Fig 2. Raw and normalized masking functions for middle maskers showing both a generally sharper contralateral masking function as well as an inconsistent relative reduction in the magnitude of the contralateral masking function.
The horizontal grey lines in the top panel indicate the peak of masking and corresponding numbers indicate the magnitude of the masked threshold shifts in μAmps. The black triangles in the middle panel indicate the masker location for ipsilateral masking. The shaded region in the bottom two panels is the area under the normalized masking function ± three electrodes (approximately ±3.3 mm) from the peak of masking.

