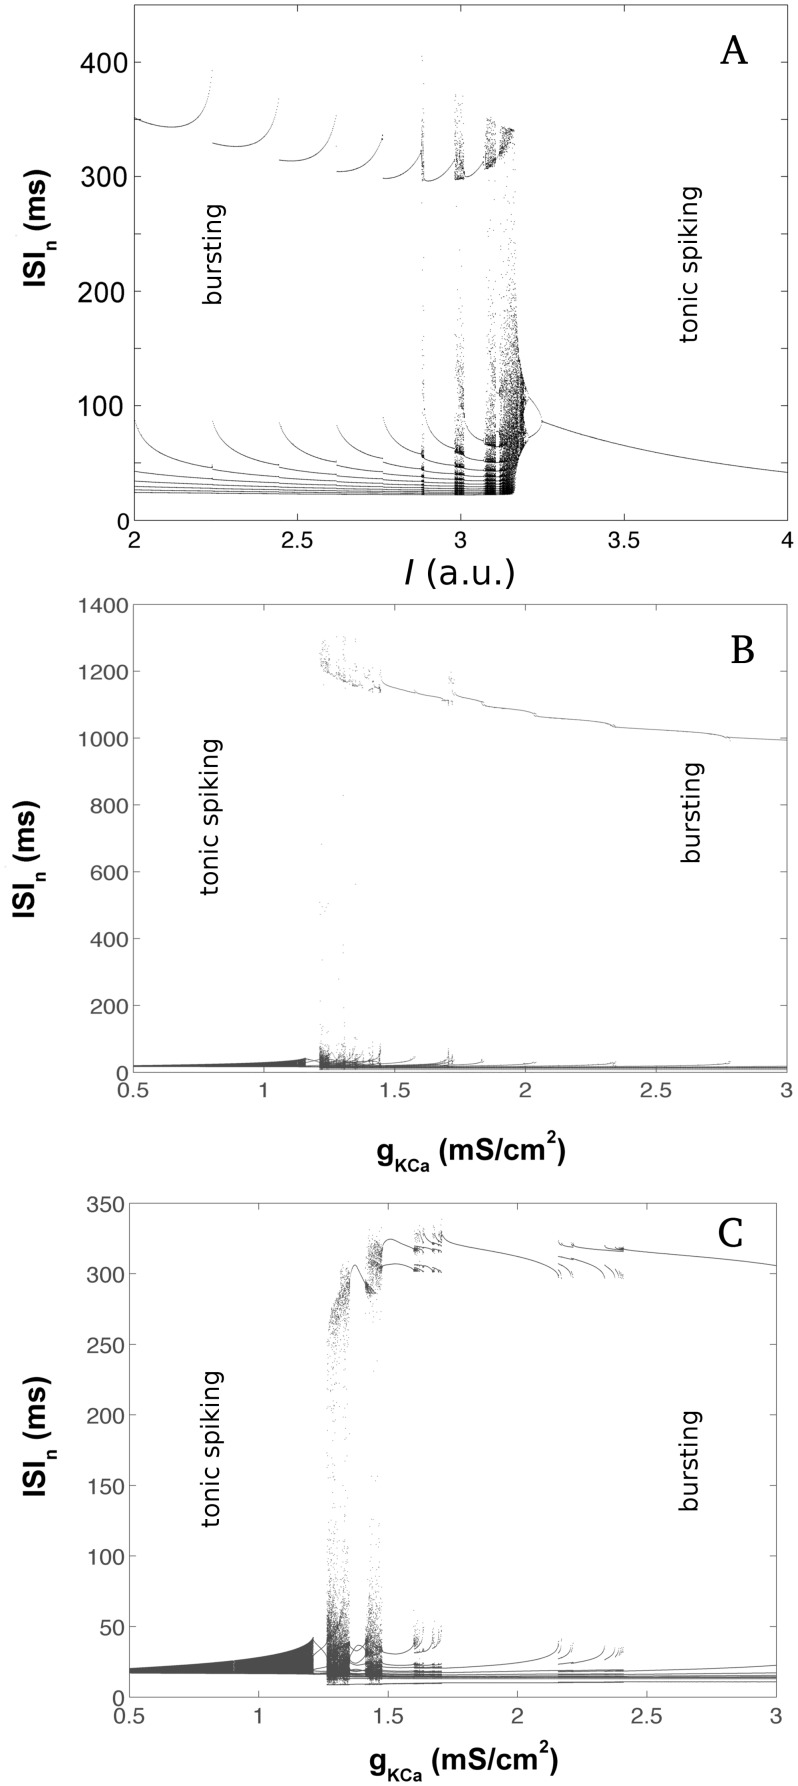
Fig 1. Bifurcation diagrams of the interspike intervals (ISIs) as a function of the intrinsic parameter in the regions that contained the transition from bursting to tonic spiking behavior.
(A) HR model neuron: up to I∼3.1 the number of spikes per burst increased with I in a period adding bifurcation; for I>3.15 the neuron was tonic. (B) The HH2C model presented tonic behavior for values of the intrinsic parameter gKCa<1.21, while for gKCa>1.21 a bursting behavior was observed. For gKCa>1.45 an inverse period adding bifurcation took place. (C) HHIH model: as in the HH2C model the transition from bursting to tonic behavior happened when the control parameter was decreased.

