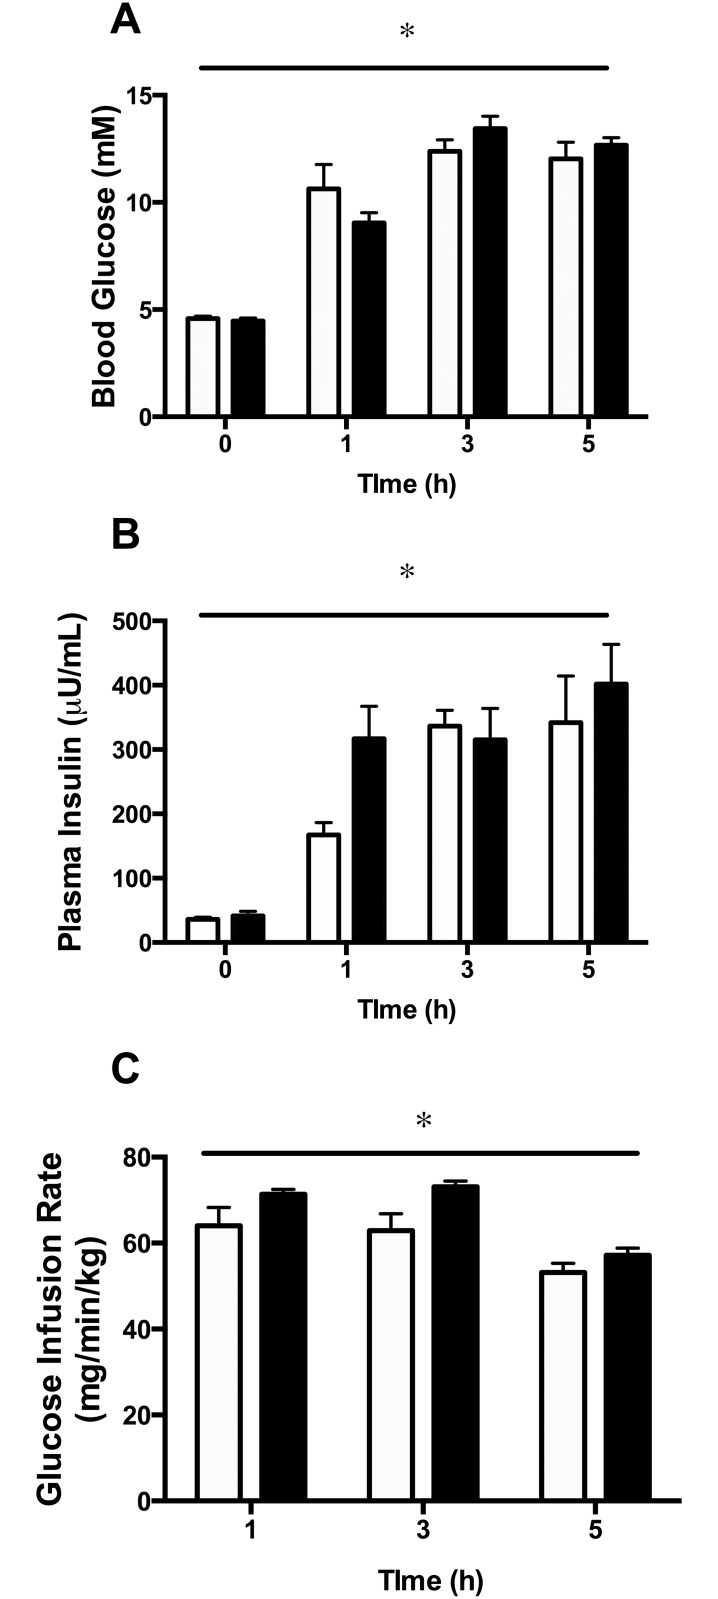
Fig 3. Blood glucose (A), plasma insulin (B) and glucose infusion rate (C) in animals overexpressing SIRT1 (white bars) or SIRT1 H363Y (black bars) in the right TC muscle.
*p<0.001 for the main effect of glucose infusion using a two-way repeated measures ANOVA. There was no significant interaction between glucose infusion and construct for any parameter measured. Data are expressed as means ± SEM. n = 4–10 animals.

