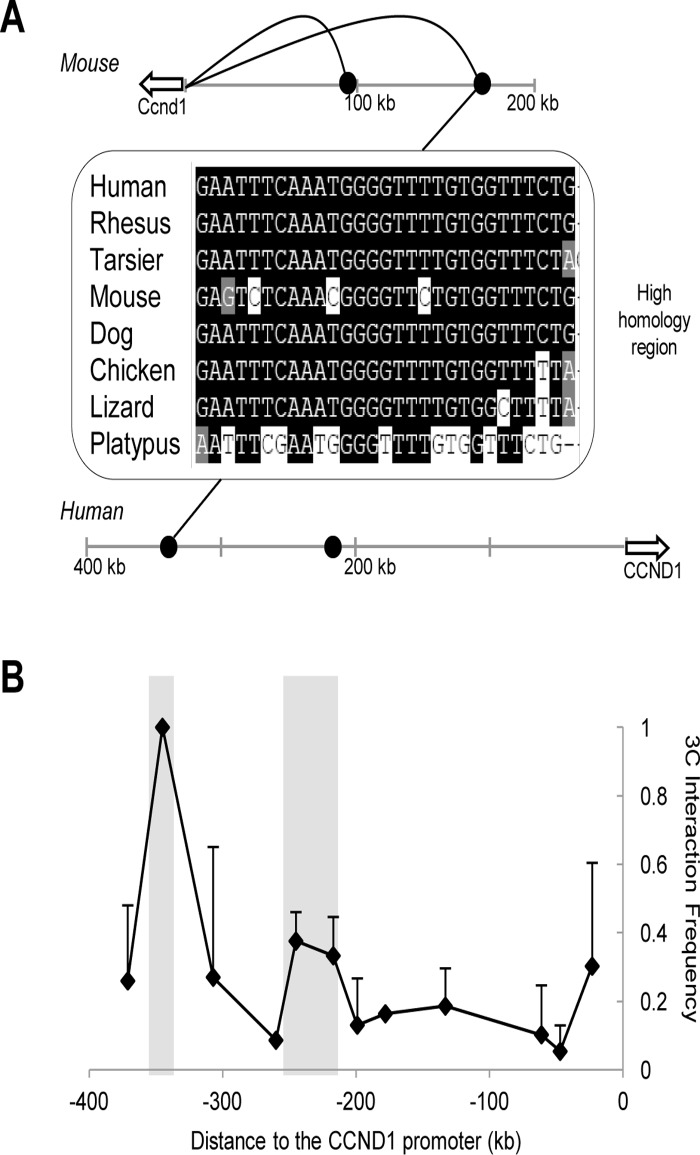
Fig 3. The chromatin architecture of the mouse Ccnd1 locus is conserved in the human genome.
(a) The DNA elements at-90 kb and -170 kb, near the bases of the chromatin loops, show high sequence homology throughout evolution. The black curves represent the chromatin loops present at the mouse locus. The sequence depicted is a portion of the high homology region observed at the-170 kb site. A similarly well-conserved homology domain is also observed at the-90 kb region and is represented by the black dots. (b) Two chromatin loops, highlighted in the graph, are detected by 3C analysis at the human CCND1 locus in the multiple myeloma cell line, H929. These loops correspond to the two loops seen within the mouse genome. Two independent 3C libraries were probed through triplicate PCRs and error bars represent S.D.

