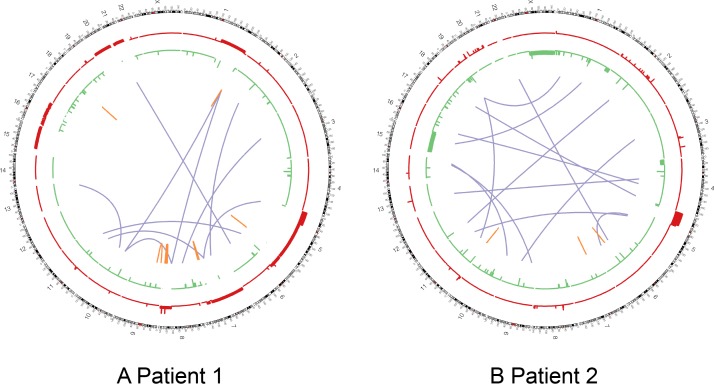
Fig 3. Patient 1 and 2 large-scale genomic alterations.
Circos Plots for patients 1 (A) and 2 (B). Copy number gains shown in red, copy number losses shown in green (height of bars is proportional to the number of copies gained or lost). Purple lines indicate interchromosomal translocations. Orange lines indicate intrachromosomal translocation.

