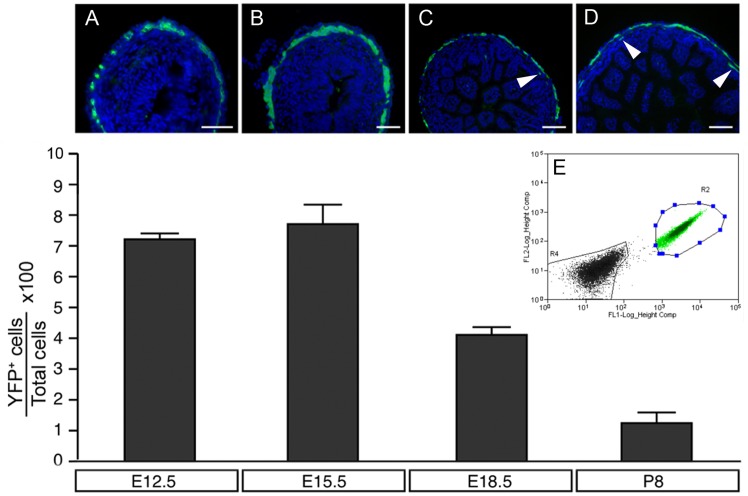
Fig 1. Distribution, selection and proportion of YFP+ve cells in developing mouse gut.
(A-D) Transverse sections of Wnt1-Cre;Rosa26 Yfp/Yfp mouse gut showing distribution of YFP+ve cells at the level of the presumptive myenteric (A-D) and submucosal (C,D arrowheads) plexuses. (E) FACS selection of YFP+ve cells. Bar graph shows the proportion of YFP+ve cells at selected stages of development. Scale bars = 50μm in A,B and 100μm in C,D.

