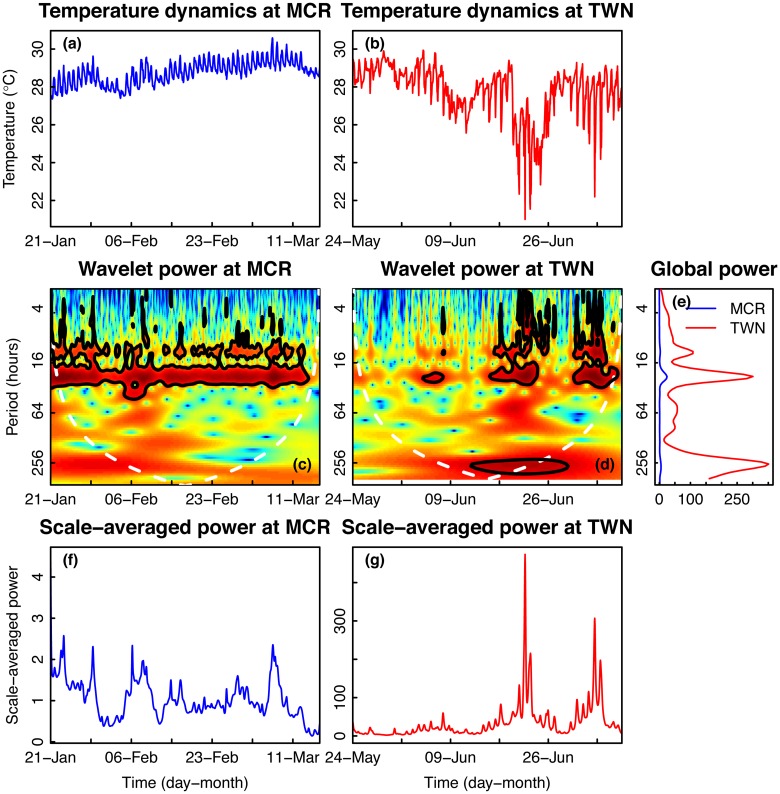
Fig 3. Time series and wavelet power analyses of seawater temperature.
Time series plots of seawater temperature collected on a fringing reef in (a) Moorea [MCR], French Polynesia and (b) Taiwan [TWN]. Wavelet power quantifies the changes of relative contribution of each period in the temperature signal to the overall variance of the signal for time series collected in (c) MCR and (d) TWN. (e) Sites were compared using wavelet power integrated over time. Wavelet power was also integrated over period to describe changes in total variance over time for MCR (f) and TWN (g).

