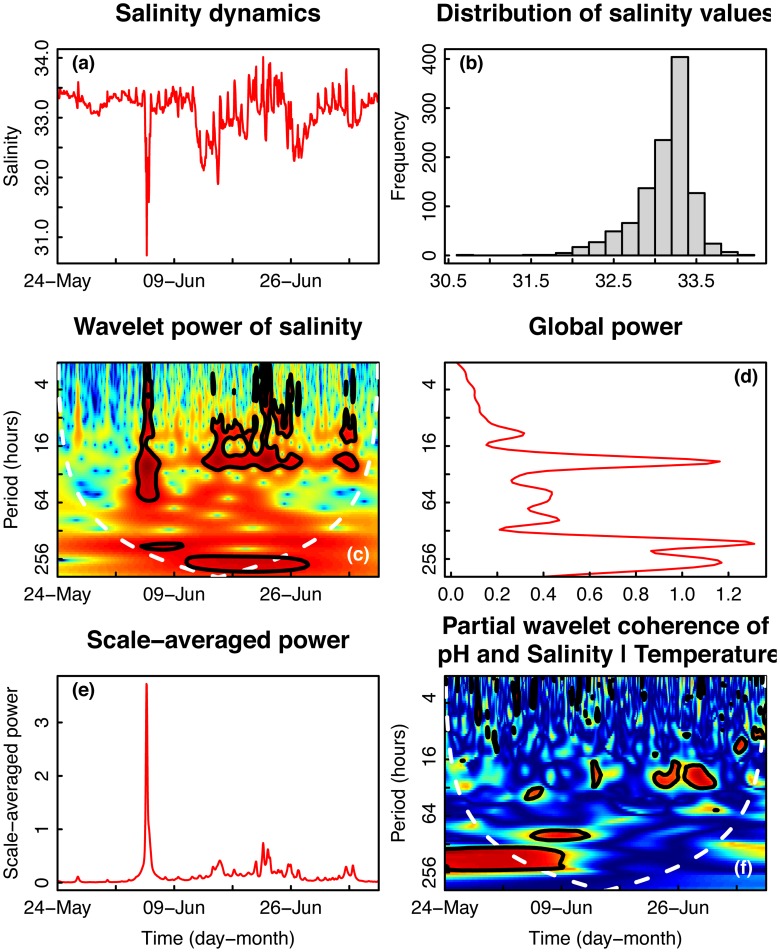
Fig 6. Time series and wavelet power analyses of seawater salinity in Taiwan.
(a) Time series plot of seawater salinity collected on a fringing reef in Taiwan [TWN]. Salinity is expressed as a unitless quantity representing kg of dissolved solids per kg seawater. (b) Histogram of frequencies of salinity. (c) Wavelet power quantifies the changes of relative contribution of each period in the pH signal to the overall variance of the signal for time series collected in Taiwan. See Fig 1 legend for details. (d) Wavelet power was integrated over time to describe changes in power over frequency. (e) Wavelet power was also integrated over period to describe changes in total variance over time. (f) Partial wavelet coherences of pH, salinity, and temperature describe correlation between the three parameters across frequency and time domains. High coherence is represented in warm colors and low power is represented in cold colors. Black contours designate regions of significantly high temporal variation. The white line represents the cone of influence—values outside of this region are less reliable due to edge effects in the analysis.

