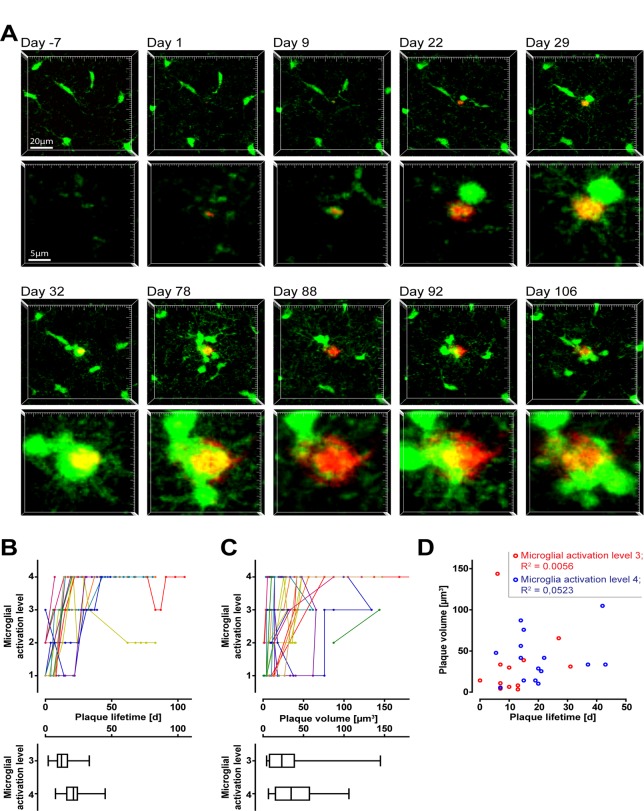
Fig 2. In vivo monitoring of amyloid plaque induced microglial activation.
In the cortex of PS1(dE9)xCX3CR1+/- mice, individual new appearing plaques (red, Methoxy-X04 stained) and the subsequent microglia activation (green) were followed using two-photon microscopy. A Time series of image projections of a newly formed plaque (starting with day 1) and the corresponding microglial reaction. The upper row indicates the microglial environment, the lower row shows the plaque in higher magnification. Notice, at day 1 a microglial process is already contacting the plaque (level 1). At day 9 this plaque was classified as level 3 and level 4 was reached at day 29. Interestingly, at day 88 the plaque is mainly liberated from enclosing microglia, which at day 92 is reverted to level 4 again. B Time dependent development of microglial activation level for each plaque (colour coded) beginning with the time point of appearance. The box plots below indicate the distribution of initial time points when microglia activation was reached (level 3 and 4). C Size dependent development of microglial activation for individual plaques (colour coded). The box plots below indicate the distribution of initial volume when microglia activation was reached (level 3 and 4). D No correlation between plaque lifetime and plaque volume when microglial activation level 3 or 4 are reached.

