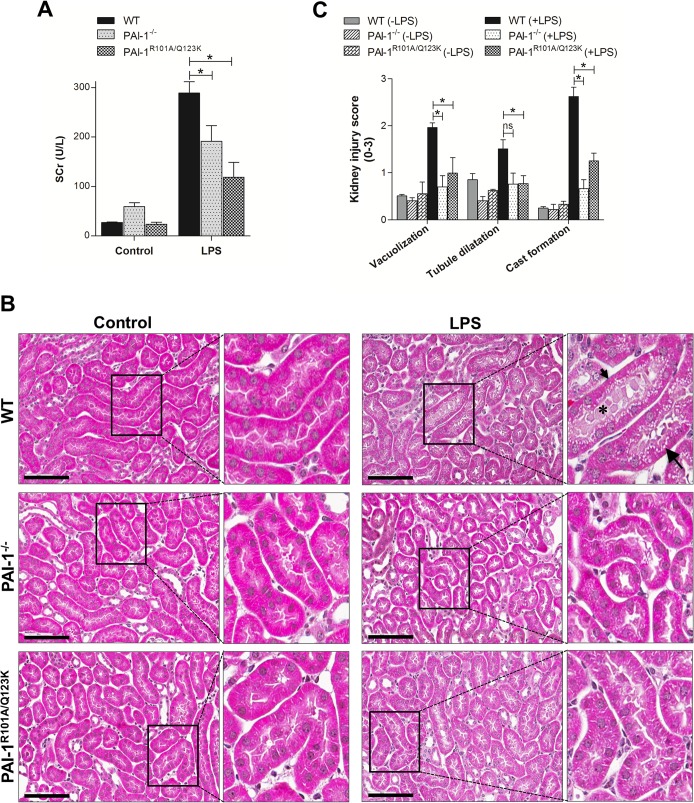
Fig 1. Assessment of kidney injury after LPS challenge.
(A) Male WT, PAI-1−/−, and PAI-1R101A/Q123K mice were assessed for kidney injury by measuring SCr levels after 24 hr LPS challenge as described. Values are expressed as mean ± SEM (N = 3–5 mice per group), *P<0.05. (B) A representative mouse renal histological image 24 hr after LPS injection. Kidney tissues were stained with H&E as described. Vacuolization (long arrow), cast formation (asterisk), and dilitated tubules (small arrow), are indicated. Magnification: 40x (scale bar, 100 μm). (C) Semiquantitative analyses of renal injury score in LPS-challenged mice as described. Data are expressed as mean ± SEM (N = 3 mice per group), *P<0.05. ns indicates not significant.

