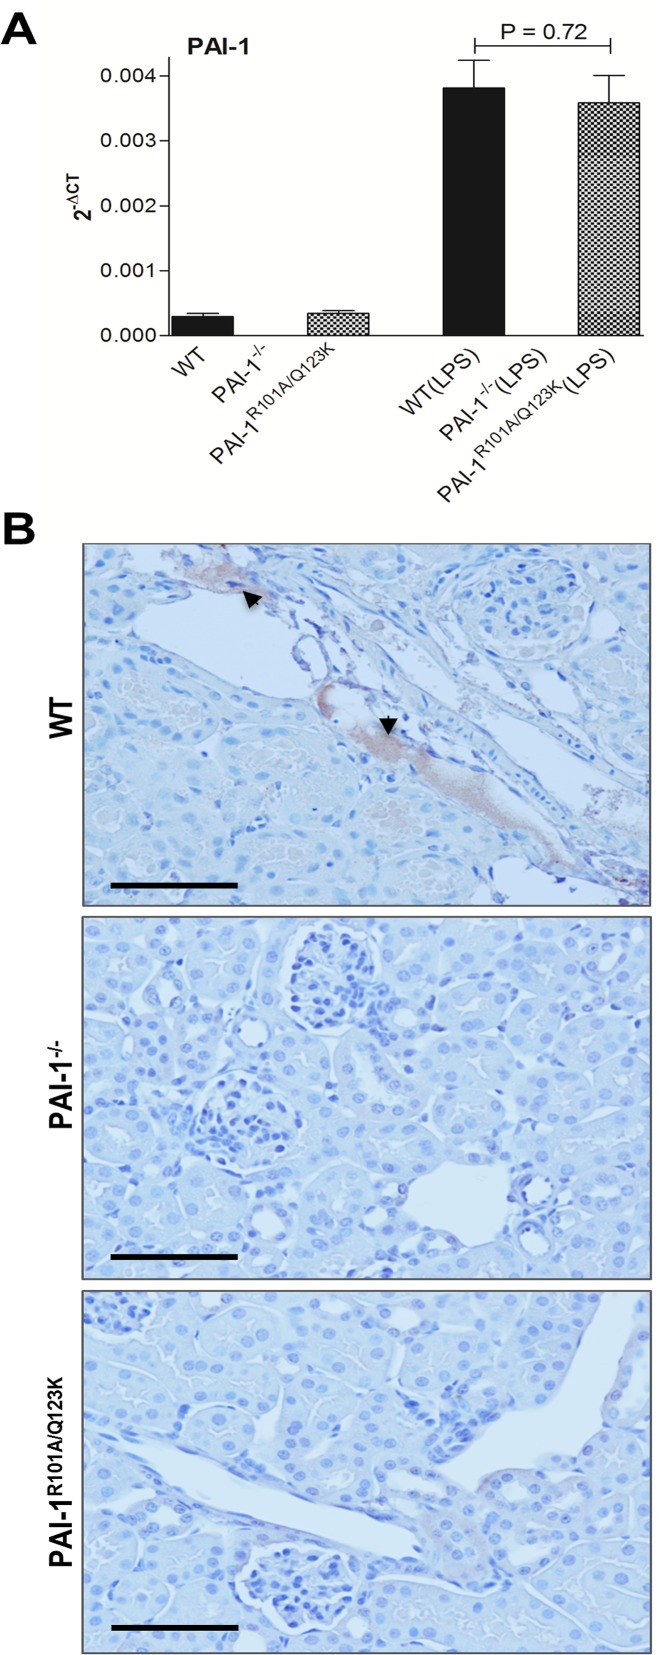
Fig 7. PAI-1 accumulation in the kidney of mice 24 hr after LPS challenge.
(A) Real-time RT-PCR analysis of renal PAI-1 mRNA expression. The mRNA expression was determined as described. Data are expressed as the mean ± SEM, (N = 4 mice per group). (B) Immunohistological staining of PAI-1 (reddish brown) in LPS-treated kidney tissues. The experiment was performed as described using a polyclonal anti-mouse PAI-1 antibody. PAI-1 staining in representative micrograph from each group is shown by arrows. Magnification: 40x (scale bar, 100 μm).

