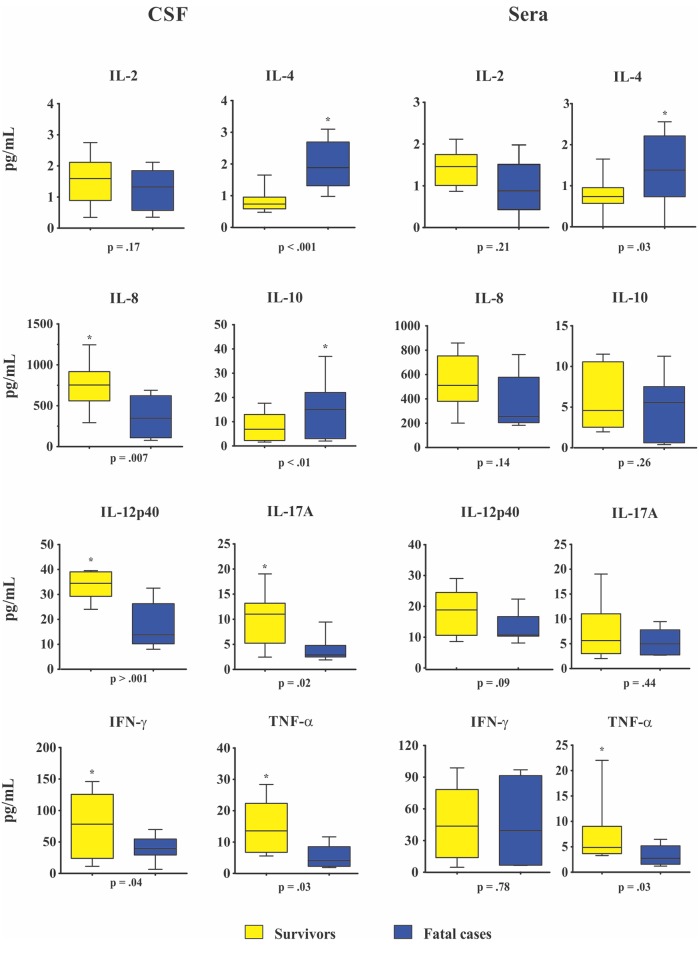
Fig 2. Baseline cerebrospinal fluid (CSF) and sera cytokines levels (pg/mL) in survivors (n = 20) and fatal cases (n = 10) at 2 week.
Data are shown as boxes: internal horizontal lines, medians; tops and bottom of boxes, 25th and 75th percentiles, respectively. Upper and lower bars, tenth and 90th percentiles, respectively. Statistical comparisons were made using the Mann-Whitney U test.

