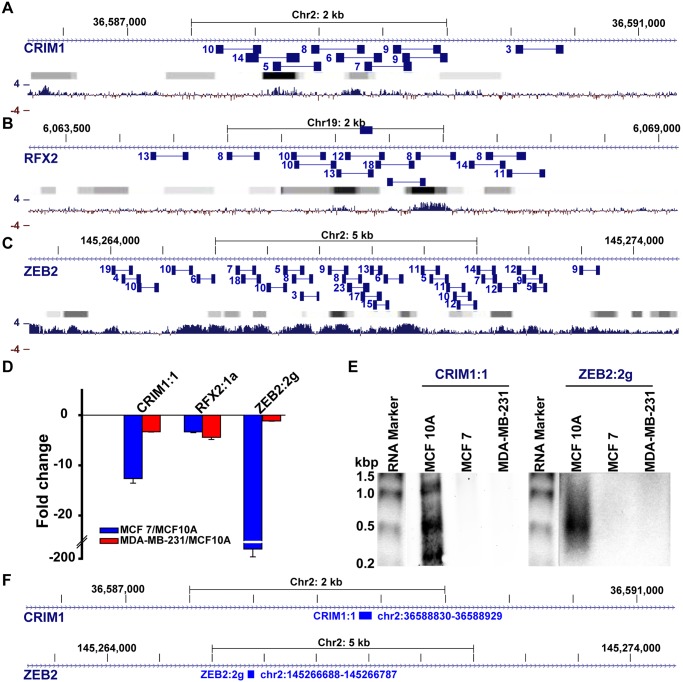
Fig 6. Paired-end sequencing read patterns confirm the presence of intronic transcripts.
A-C) The number of reads obtained from overlapping paired sequence reads (connected blue boxes) are indicated next to each paired read. Gradient bars (grey to black) represent known transcription factor binding sites obtained from ENCODE ChIP-Seq experiments, generated using UCSC genome browser; darker boxes represent increased transcription factor binding signal strengths across ENCODE experiments. Bottom bar plotgraphs (blue) represent the extent (4 = high, -4 = low) of evolutionary conservation in placental mammals. Reads obtained at locations of CRIM1:1 (A), RFX2:1a (B), and ZEB2:2g (C) reveal clusters of transcript regions that are generally located next to known transcription factor binding sites (Gradient bars) and highly conserved locations (blue). D) qPCR detection of differential expression of CRIM1, RFX2, and ZEB2 intronic transcripts in model breast cancer lines (MCF-7 and MDA-MB-231), in comparison to the model epithelial (normal) cell line, MCF10A. E) Analysis of CRM1:1 and ZEB2:2g locations by northern blot reveals the overabundance of novel transcripts that range from ~300–1000 nts for CRIM1:1 and ~500nts for MCF10A. F) the location of probes used for the northern blot.

