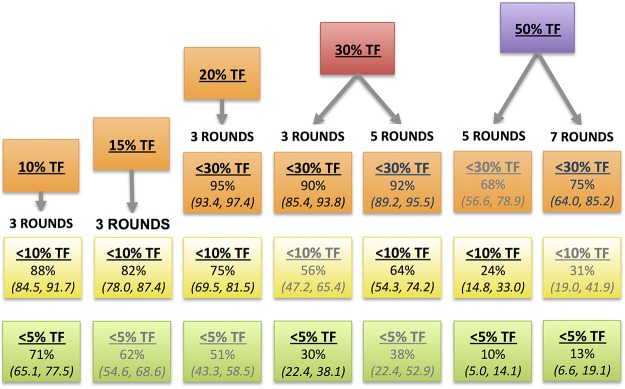
Fig 5. Predicted probabilities (± standard errors) of reduction from baseline TF1–9 prevalence to lower prevalence categories.

Each probability is cumulative over the lower ordered values, such that the probability of being <30% includes the probability of being <10% and <5%. Predictions not significant at α = 0.10 are in gray.
