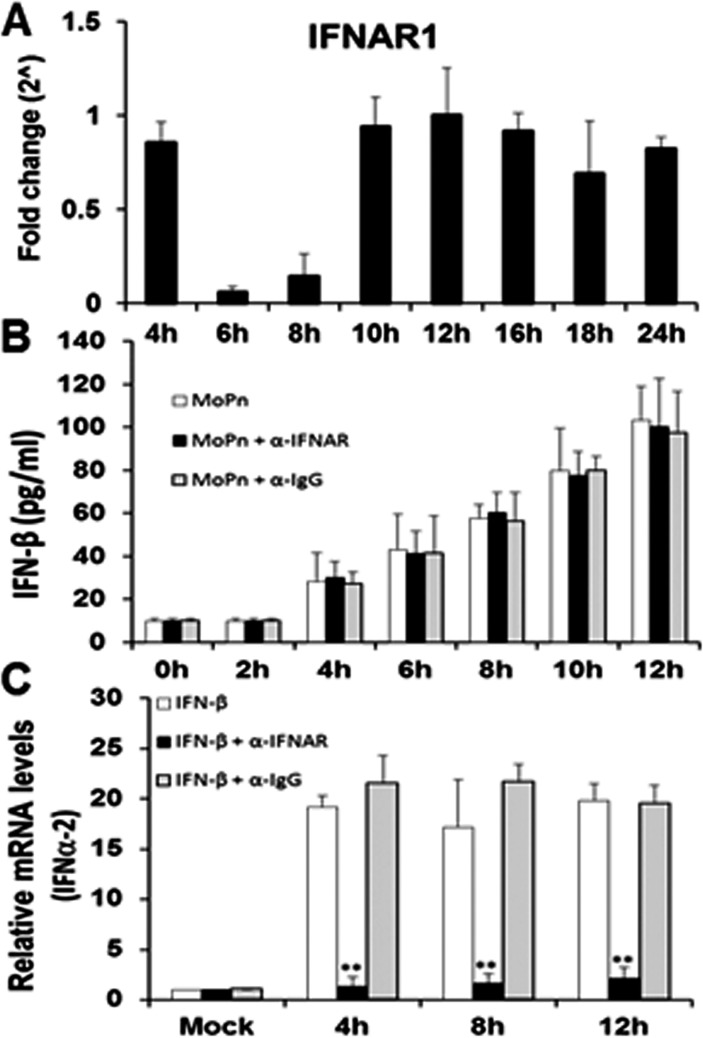
Fig 3. IFNAR1 early gene expression and function during the course of C. muridarum infection.
(A) Bm1.11 cells were infected with 10 IFU/ cell C. muridarum and the transcription levels of IFNAR1 was measured by RT-qPCR after total cell mRNA was harvested at each time-point indicated. (B) Bm1.11 cells were infected with 10 IFU/cell C. muridarum in the presence or absence of either the IFNAR1-specific antibody (denoted as α-IFNAR) or the isotype control (denoted as α-IgG) at 1h post-infection, and the amount of IFN-β secreted into the supernatants during the first 12 h of infection was measured by ELISA. (C) Bm1.11 cells were incubated for 1h in media alone or in media containing either the IFNAR1-specific antibody or the isotype control, before adding 50U/ml recombinant murine IFN-β. Total cell mRNA was harvested after cells were exposed to recombinant IFN-β for an additional 12h, and IFNα-2 transcription was measured by RT-qPCR at the time-points listed. The results shown are representative of three independent experiments; Fold change and relative mRNA levels are compared to Mock-infected controls; ** = p< 0.01 when compared to cells treated with recombinant IFN-β alone.

