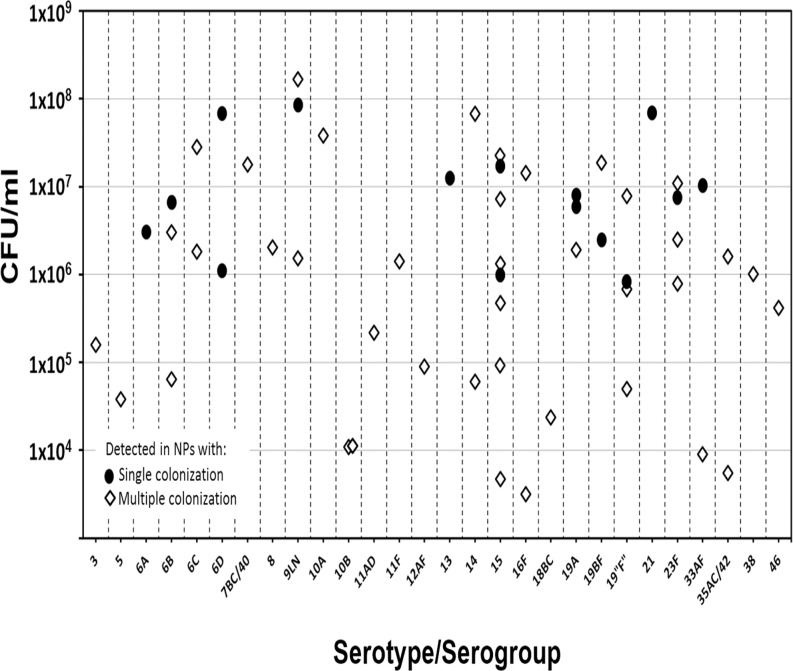
Fig 1. Distribution and densities of S. pneumoniae serotypes in single or multiple colonized nasopharyngeal (NP) samples.
Density (CFU/ml as determined by lytA qPCR) of the specified serotype is presented on the x axis. Symbols for each serotype indicates the number of times they were detected as a unique serotype (•) or in samples with multiple colonization (◊).

