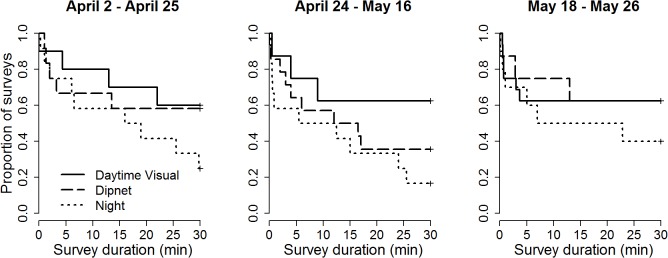
Fig 3. Interaction plot of survival curves depicting the distribution of marbled salamander (Ambystoma opacum) time to detection for the each method category during three date windows.

The categories for which salamanders were detected most readily yielded the shortest surveys, and thus have survival curves that appear lower on the vertical axis.
