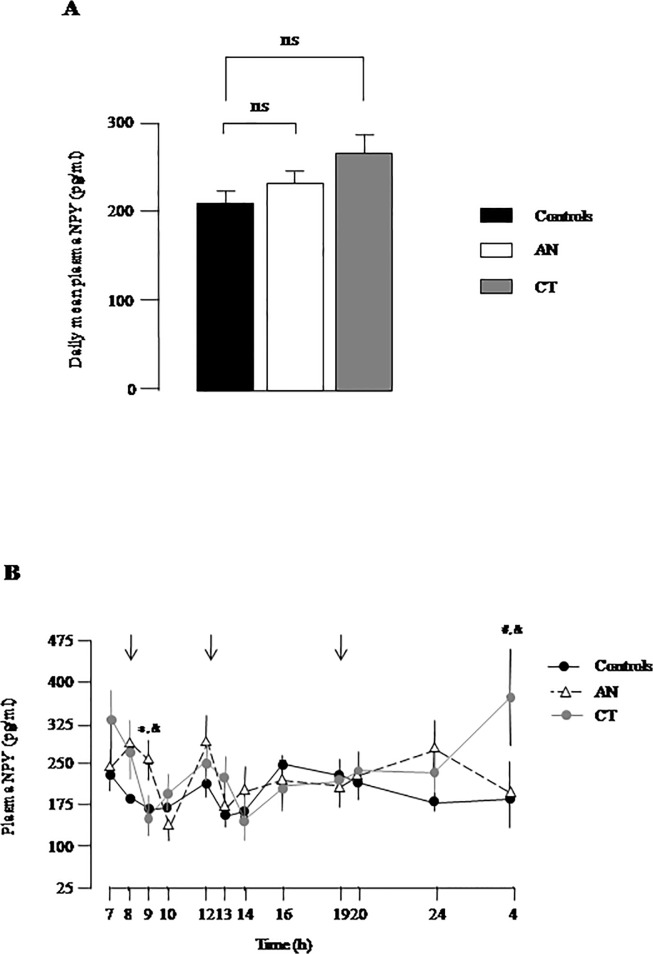
Fig 1. Plasma NPY levels in women with low body weight.
(A) Daily mean values of plasma NPY levels in young women with anorexia nervosa (AN), constitutional thinness (CT) and in controls (Controls). Data represent means ± SEM of 4 independent experiments. ns, non significant. (B) Twelve-point circadian plasma levels of NPY in AN, CT and controls. The arrows indicate meal schedule. Each point represents mean ± SEM of 4 independent experiments. Significant point-by-point intergroup differences (p< 0.05): *, AN vs C; #, CT vs C; &, AN vs CT.

