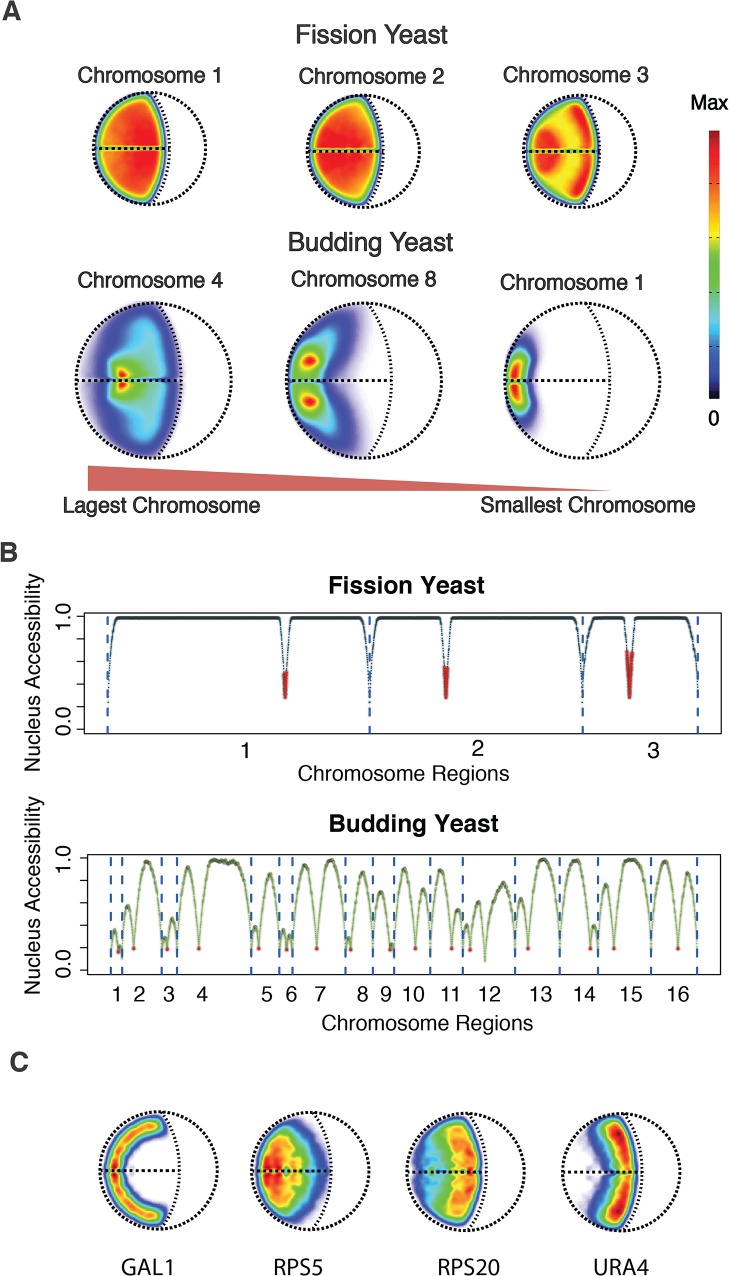
Fig 3. Chromosome and gene territories analysis of fission yeast and budding yeast.
(A) Chromosome localization probability density (LPD) plots for fission yeast (top panel) and selected chromosomes in budding yeast for comparison (lower panel)[29]. The chromosomes are ordered by their size from largest (left) to smallest chromosomes (right). (B) Comparison of the nucleus accessibility of genomic regions between fission yeast and budding yeast (S1 Text). The higher the accessibility, the more space it can explore the nucleus. The red dots in red represent the centromeric locations. (C) Gene localization probability density (LPD) plots for four genes in fission yeast. Their orthologous genes were also analyzed in the budding yeast genome models [29].

