
Fig 5. Functional connectivity for sensory and global components.
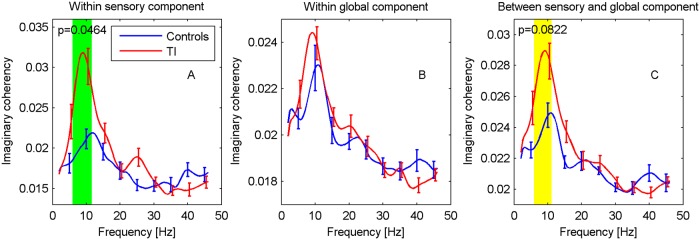
Imaginary coherency is shown (A) within ACs, (B) within global network, (C) between ACs and global network. Frequency regions with significant differences (p<0.05, green) were determined with a cluster-based permutation test, regions with 0.05≤p≤0.1 are marked in yellow.