
Fig 7. Correlations between TI handicap score and functional connectivity.
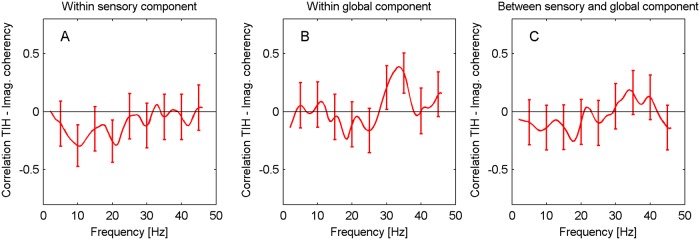
Correlations for TI participants are shown (A) within the ACs, (B) within the global network, (C) between the ACs and the global network.
Official websites use .gov
A
.gov website belongs to an official
government organization in the United States.
Secure .gov websites use HTTPS
A lock (
) or https:// means you've safely
connected to the .gov website. Share sensitive
information only on official, secure websites.
Correlations for TI participants are shown (A) within the ACs, (B) within the global network, (C) between the ACs and the global network.