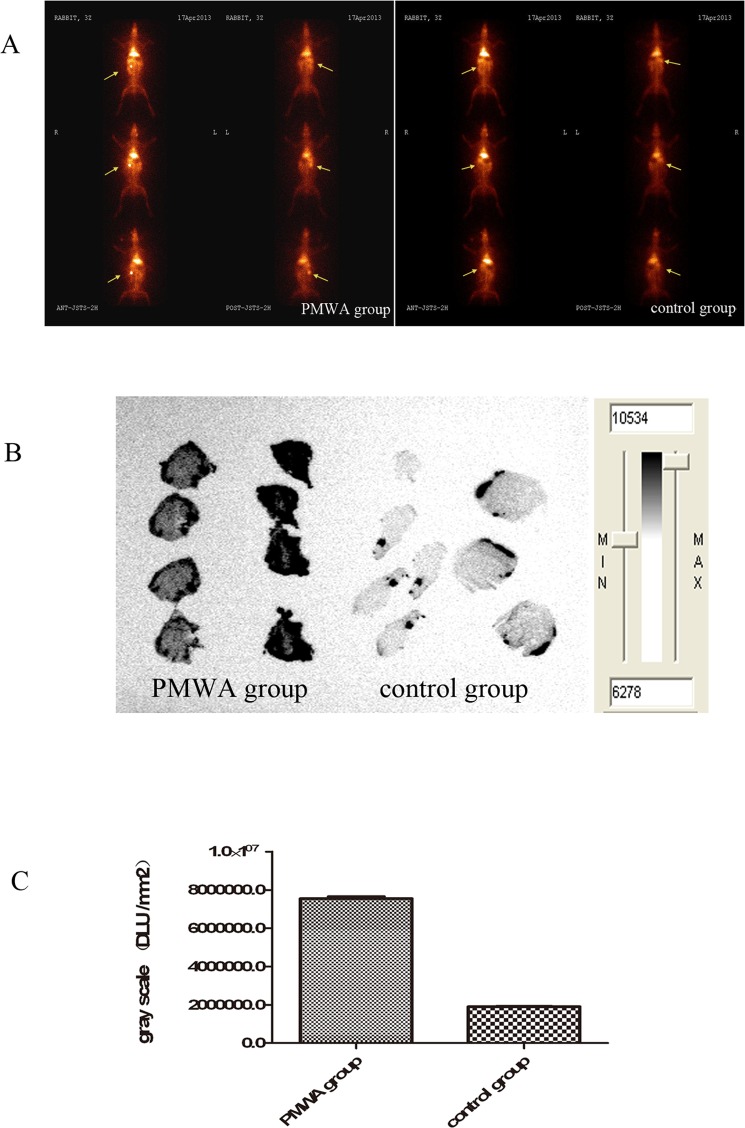
Fig 3. Differences in uptake of 131I-hypericin in the control group and PMWA group.
(A) In vivo planar scintigtaphy. The arrows indicate the VX2 tumors, which had been inoculated underneath the right second nipple. The radioactivity overtly accumulated in the necrotic tumors in the PMWA group; By contrast, no radioactivity accumulated in the tumors in the control group. (B and C) The gray scale regarding IIIH was significantly higher. There was a significant difference in the gray scale between the control group and the PMWA groups.

