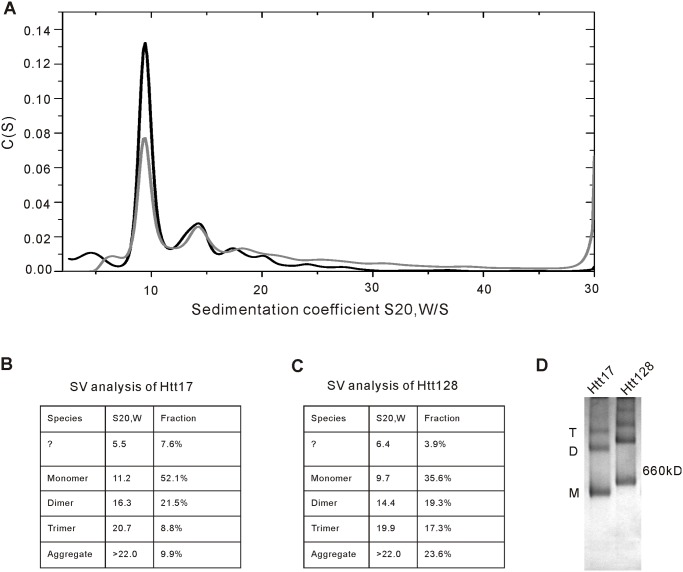
Fig 4. Polyglutamine expansion correlates with an enhanced formation of oligomers and aggregates.
(A) c(s) distributions of Htt17 (black curve) and Htt128 (grey curve) obtained by Sedfit analysis, indicating one major peak at 10 S for the momoneric species. Dimers and trimers are observed around 15 S and 20 S, respectively. At s-values higher than 22 S oligomers of higher order and aggregates are detectable. (B, C) Summary of the sedimentation viscosity (SV) analysis of Htt17 and Htt128. The main species in both samples is the monomeric form (52.1% and 35.6%). Dimers have a fraction size from around 20% and trimers are higher populated in the Htt128 sample (17.3% vs. 8.8%). The amount of visible higher oligomers and aggregates is more pronounced in Htt128. Note: the AUC analyses of Htt17 and Htt128 were performed in two independent analyses likely explaining the smaller s20,W-value of Htt128 in this experiment. (D) Htt17 and Htt128 were analyzed with HR-native PAGE and Coomassie Blue staining with a result that was consistent with the SV analysis. M: Htt monomer; D: Htt dimer; T: Htt trimer.

