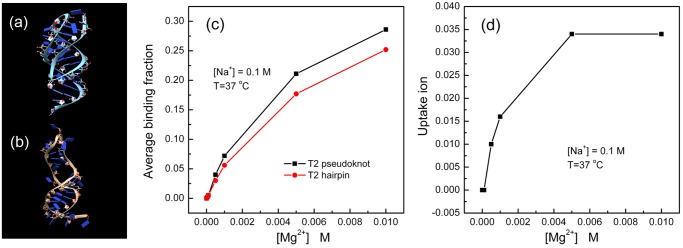
Fig 7. The binding fraction and the uptake of Mg2+ ions as a function of [Mg2+].

(a) and (b) show the 3D structures of the T2 pseudoknot (the folded state) and T2 hairpin (the intermediate state), respectively; (c) shows the binding fraction curves for the T2 pseudoknot (black) and the hairpin (red). (d) shows the Mg2+ uptake as a function of [Mg2+].
