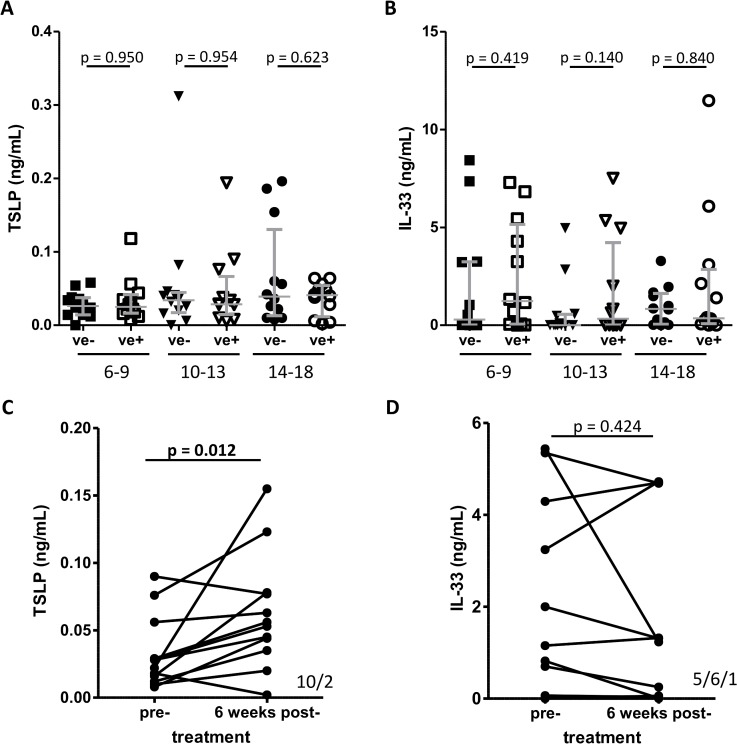
Fig 4. Comparison of plasma TSLP and IL-33 levels in relation to S. haematobium infection.
Plasma levels of (A) TSLP and (B) IL-33 were measured by ELISA and data were divided into three age group and S. haematobium egg negative (ve-, closed symbols) compared to egg positive (ve+, open symbols) individuals. Grey lines indicate median and the interquartile range. Levels were compared using a Kruskal-Wallis test followed by a multiple comparison of egg positive versus egg negative children. Plasma levels of (C) TSLP and (D) IL-33 from 12 individuals (as described for Fig. 3) were compared pre- and 6 week’s post-treatment. P-values are obtained from a Wilcoxon signed-rank test and positive/negative/unchanged ranks are shown in the lower-right corner of panel (C) and (D).

