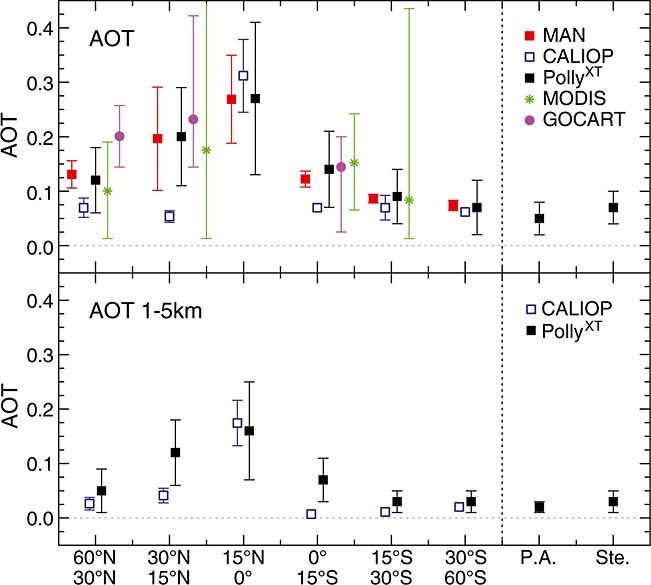
Figure 4.

(Top) Mean AOT at 532nm for different latitudinal belts derived from Polly XT observations during three transatlantic cruises of Polarstern in 2009 and 2010 (black), from CALIOP overpasses (532nm, blue) during Polarstern observations, and from MAN Sun photometer observations (500nm) above the Atlantic from 2004–2011 (red), compared to MODIS satellite observations [Kaufman et al. 2005] (green), and AOT values modeled with GOCART (pink) [Chin et al. 2002]. Error bars show the range of measured AOTs (standard deviation for MAN, Polly XT, CALIOP observations). Exact latitudinal ranges are given in the text. (Bottom) Mean AOT at 532nm from Polly XT observations and CALIOP observations for the height range from 1 to 5km height (free troposphere). P.A. and Ste. denote the measurement sites at Punta Arenas (53°S), Chile and Stellenbosch (34°S), South Africa.
