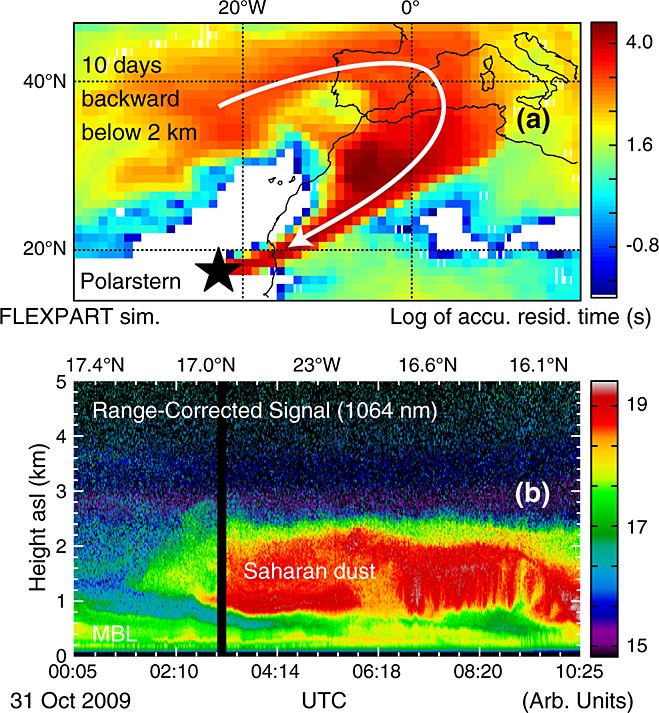
Figure 5.

Map of (a) FLEXPART 10-day backward simulation of the observed air mass between 800–2500m height on 31October 2009 (3:20–5:20UTC) advected from the surface to 2000m height. The most probable air mass advection path is illustrated by a white arrow. The position of Polarstern is given by the star. (b) Height-time display of the range-corrected signal observed at 1064nm with the Polly XT lidar. A thick Saharan dust plume with lidar-derived AOT of 0.22 passed above the Polarstern.
