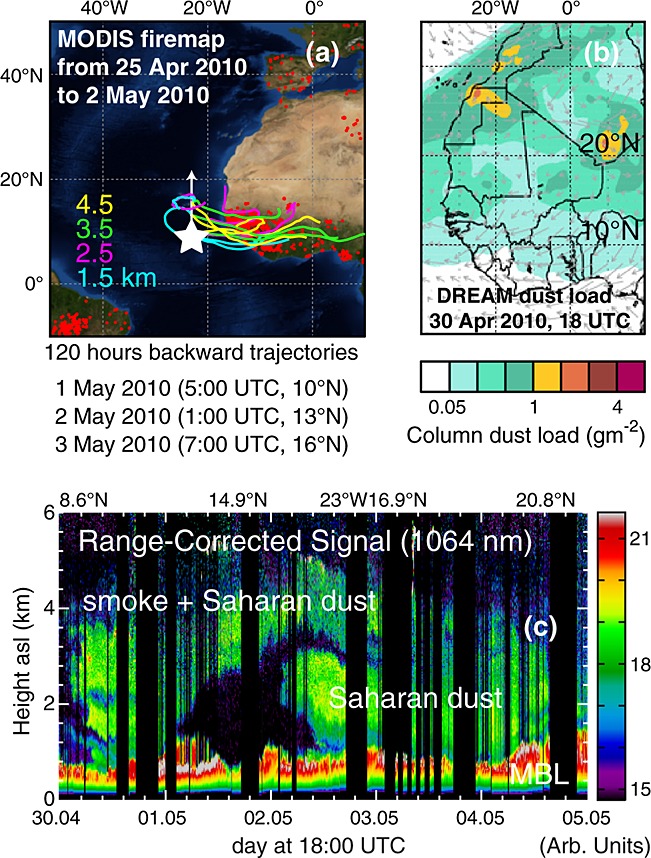
Figure 7.

(a) Fire map derived from MODIS measurements and HYSPLIT 120-h backward trajectories for different arrival heights (indicated by different colors). Trajectory arrival times are given below the map. The white arrow shows the Polarstern cruise track from 30April to 5May 2010. (b) DREAM simulations of column dust load on 30April 2010, 18:00UTC. (c) Height-time display of the lidar backscatter signal from 30 April to 5 May 2010 showing complex aerosol layering of dust and smoke ( > 1000m) above the marine boundary layer (MBL). Lidar overlap effects (for heights < 400m) are not corrected.
