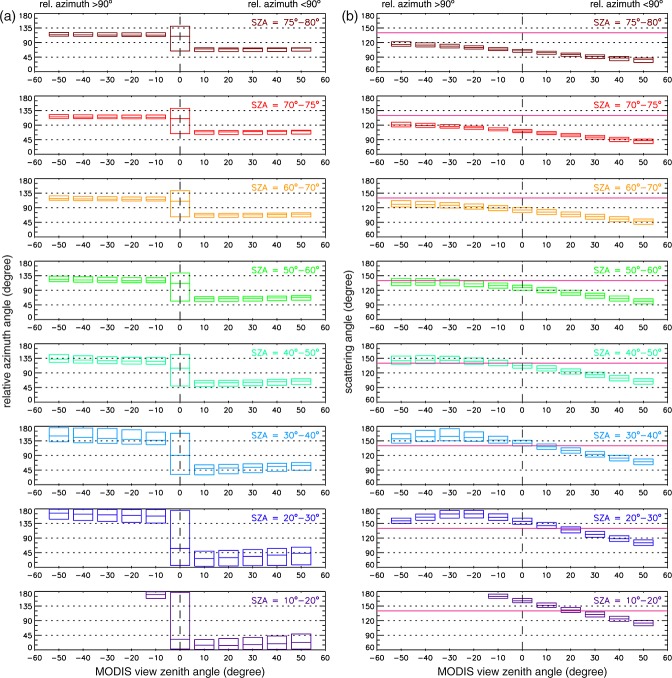
Figure 2.
Distribution of sampled Aqua-MODIS (a) relative azimuth angles and (b) scattering angles as a function of VZA and SZA. The top and bottom of a box represent the 5th and 95th percentiles, while the horizontal line within a box is the median. The rainbow scattering angle of 139° is also marked.

