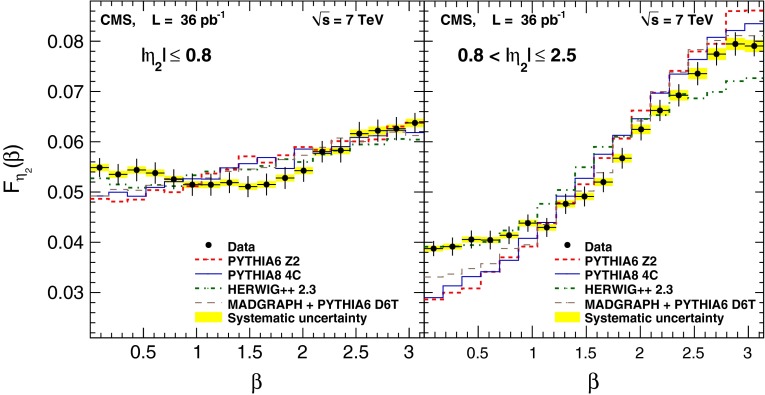
Fig. 4.
Observed distributions for the data, corrected for detector effects, and for the MC generators (pythia 6, pythia 8, herwig++, and MadGraph + pythia 6) in the central () and forward () regions. The error bars show the statistical uncertainties, while the yellow shaded bands correspond to the combined systematic uncertainty

