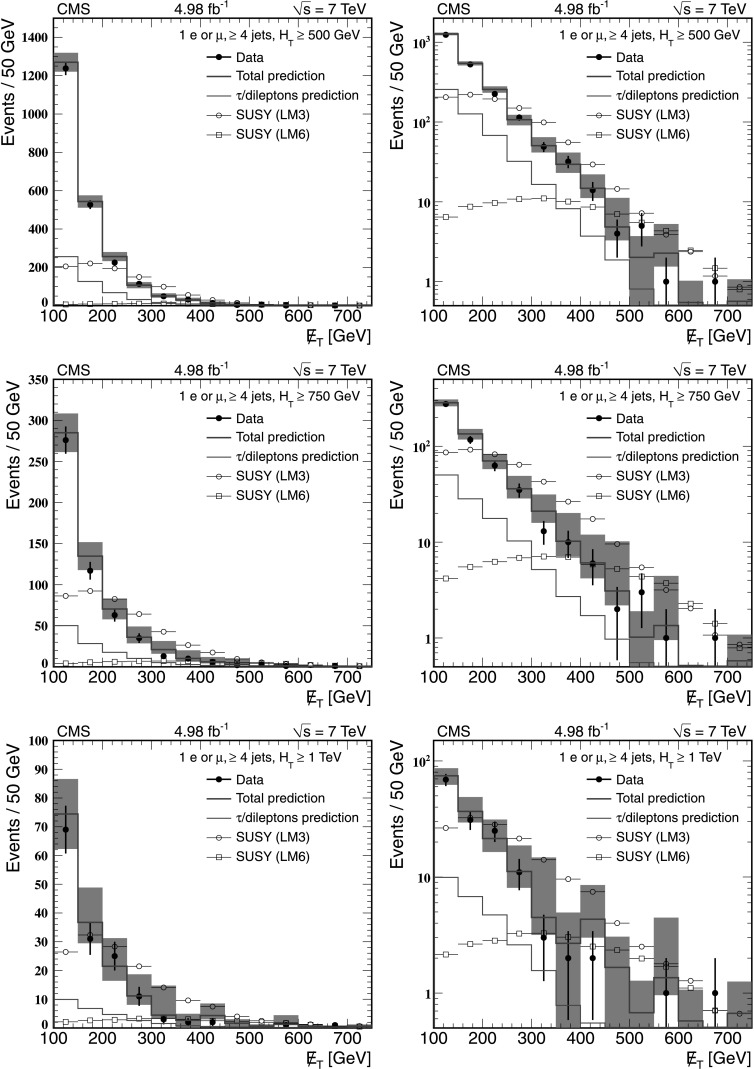
Fig. 3.

Lepton Spectrum method: observed  distributions in data (filled points with error bars) compared with predicted
  distributions (green bars) in the combined electron and muon channels, on linear (left) and logarithmic (right) scales. Three different H
T thresholds are applied: H
T≥500 GeV (upper row), H
T≥750 GeV (middle row), and H
T≥1000 GeV (lower row) (Color figure online)
