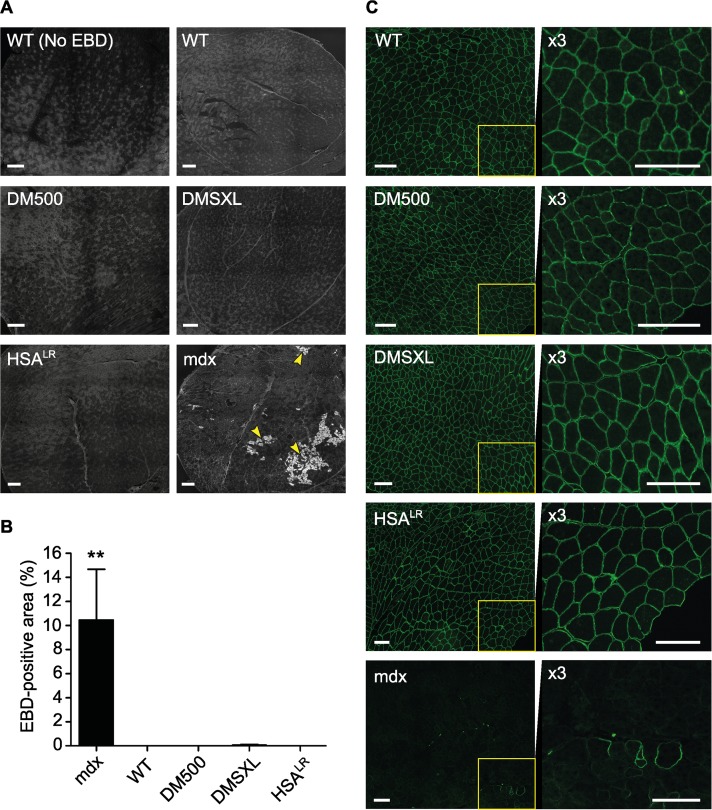
Fig 2. Membrane integrity analysis in mouse quadriceps muscle.
(A) Representative images of quadriceps sections from DM1 mice and controls after injection with EBD following exercise. One WT mouse was not injected to appreciate autofluorescent background signal (No EBD). Areas with EBD-positive fibers were regularly seen in mdx samples (arrowheads), but never in WT nor DM1 model samples. Scale bars indicate 250 μm. (B) Quantification of the EBD-positive area compared to total muscle section (n = 4 per group). (C) Representative images of quadriceps sections stained for dystrophin. Staining intensity and pattern observed in WT animals were very similar to those observed in DM500, DMSXL and HSA LR mice. Right panels show high magnifications of insets to appreciate dystrophin staining. As expected, essentially no signal was detected in mdx mice. Scale bars indicate 150 μm.

